Fig. 7
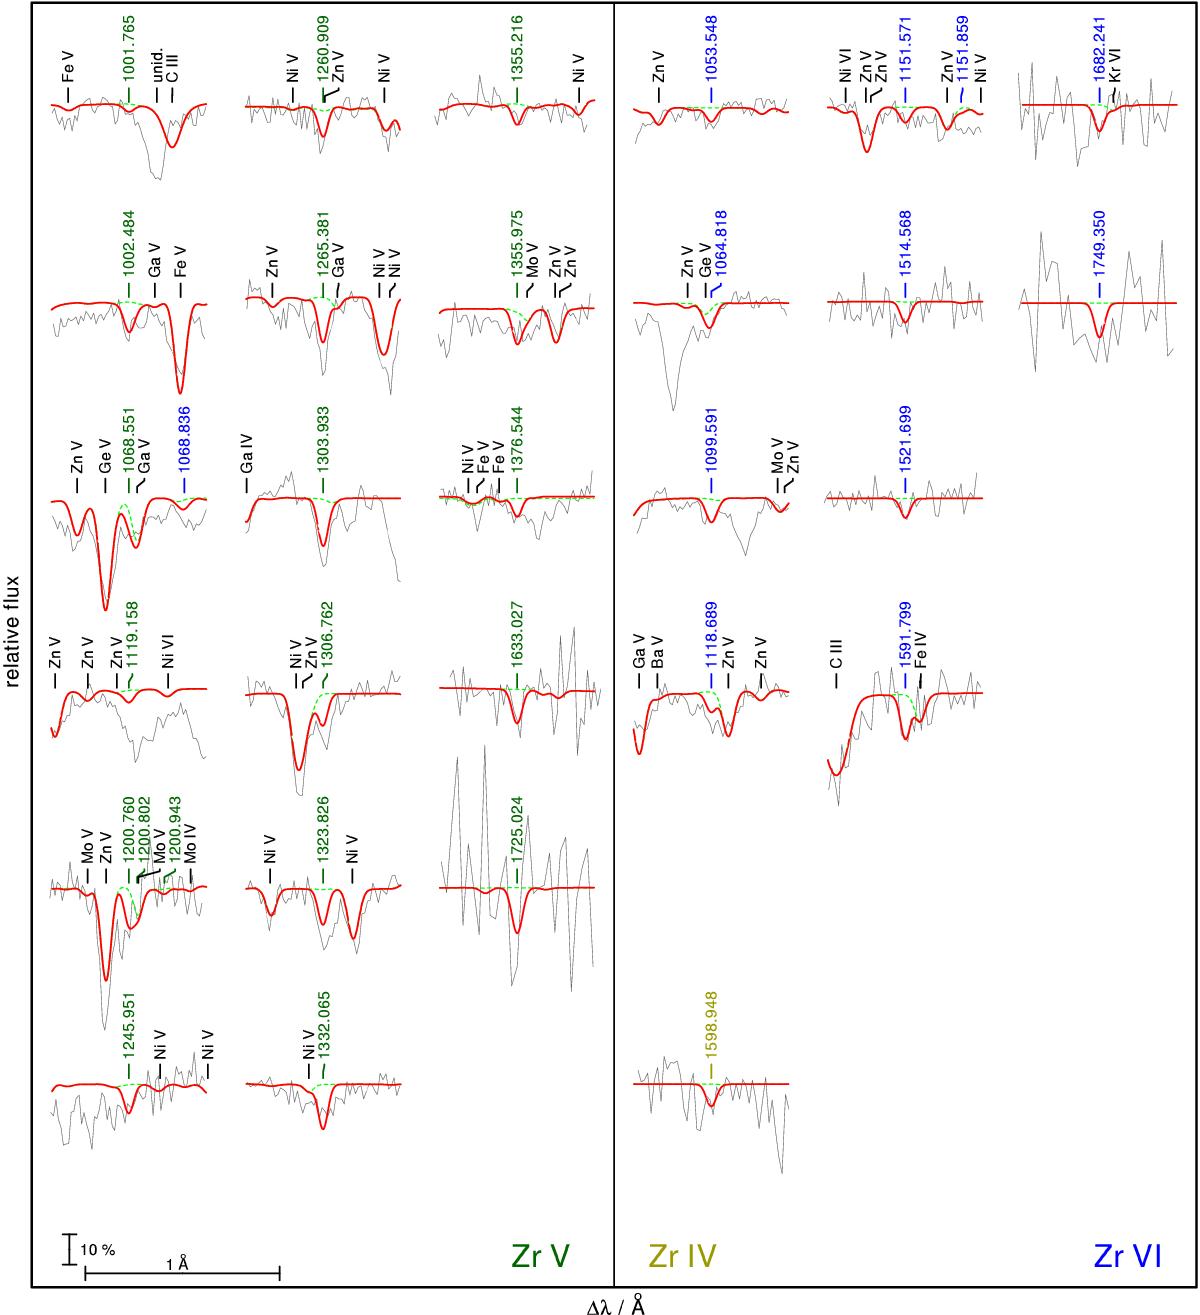
Identified Zr iv (bottom of right panel), Zr v (left panel), and Zr vi (right panel) lines in the FUSE (λ < 1188 Å) and HST/STIS observations of RE 0503−289. The model (thick, red line) was calculated with an abundance of log Zr = −3.5. The dashed green spectrum was calculated without Zr. Prominent lines are marked, the Zr lines with their wavelengths from Tables A.9–A.11.
Current usage metrics show cumulative count of Article Views (full-text article views including HTML views, PDF and ePub downloads, according to the available data) and Abstracts Views on Vision4Press platform.
Data correspond to usage on the plateform after 2015. The current usage metrics is available 48-96 hours after online publication and is updated daily on week days.
Initial download of the metrics may take a while.