Fig. 4
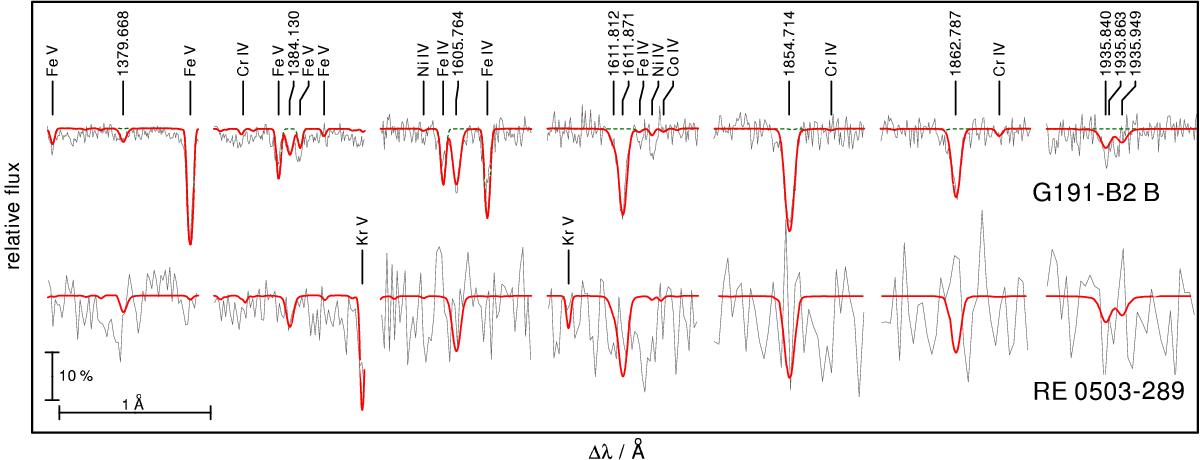
Comparison of sections of the STIS spectra with our models for G191−B2B (top) and RE 0503−289 (bottom). The Al abundances are 1.1 × 10⁻⁵ (0.2 times the solar value, Rauch et al. 2013) and 5.3 × 10⁻⁵ (solar), respectively. In the top part, the green dashed line is a spectrum calculated without Al. Prominent lines are marked, the identified Al iii lines with their wavelengths.
Current usage metrics show cumulative count of Article Views (full-text article views including HTML views, PDF and ePub downloads, according to the available data) and Abstracts Views on Vision4Press platform.
Data correspond to usage on the plateform after 2015. The current usage metrics is available 48-96 hours after online publication and is updated daily on week days.
Initial download of the metrics may take a while.