Fig. 3
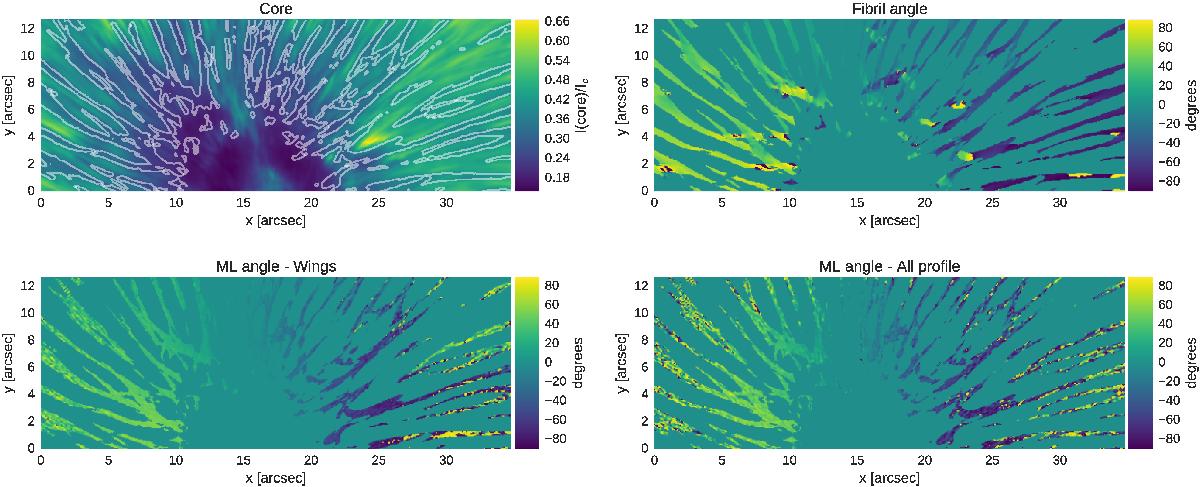
Upper left panel: image at the core of the Ca ii line in units of the average continuum intensity in the quietest region of the map. Upper right panel: estimated fibril angle using the RHT in the considered pixels. Lower panels: maximum-likelihood estimation of the azimuth angle obtained from the Stokes Q and Stokes U signal using only wavelengths on the wings (left panel) or the full line profile (right panel).
Current usage metrics show cumulative count of Article Views (full-text article views including HTML views, PDF and ePub downloads, according to the available data) and Abstracts Views on Vision4Press platform.
Data correspond to usage on the plateform after 2015. The current usage metrics is available 48-96 hours after online publication and is updated daily on week days.
Initial download of the metrics may take a while.