Free Access
Fig. 2
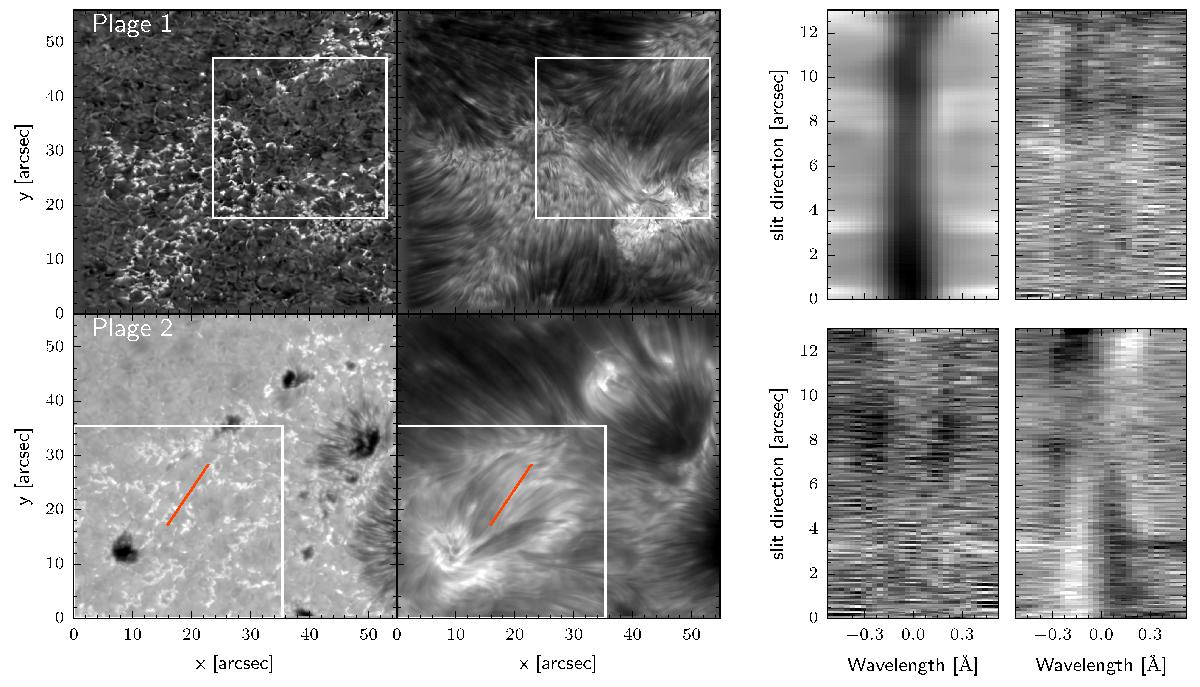
Plage observations, marking the analyzed region with a rectangle. The left panel shows the images in the continuum (left column) and in the core of the Ca ii 8582 Å line. The right panel displays an artificial slit along the orange line for Plage 2.
Current usage metrics show cumulative count of Article Views (full-text article views including HTML views, PDF and ePub downloads, according to the available data) and Abstracts Views on Vision4Press platform.
Data correspond to usage on the plateform after 2015. The current usage metrics is available 48-96 hours after online publication and is updated daily on week days.
Initial download of the metrics may take a while.