Fig. 1
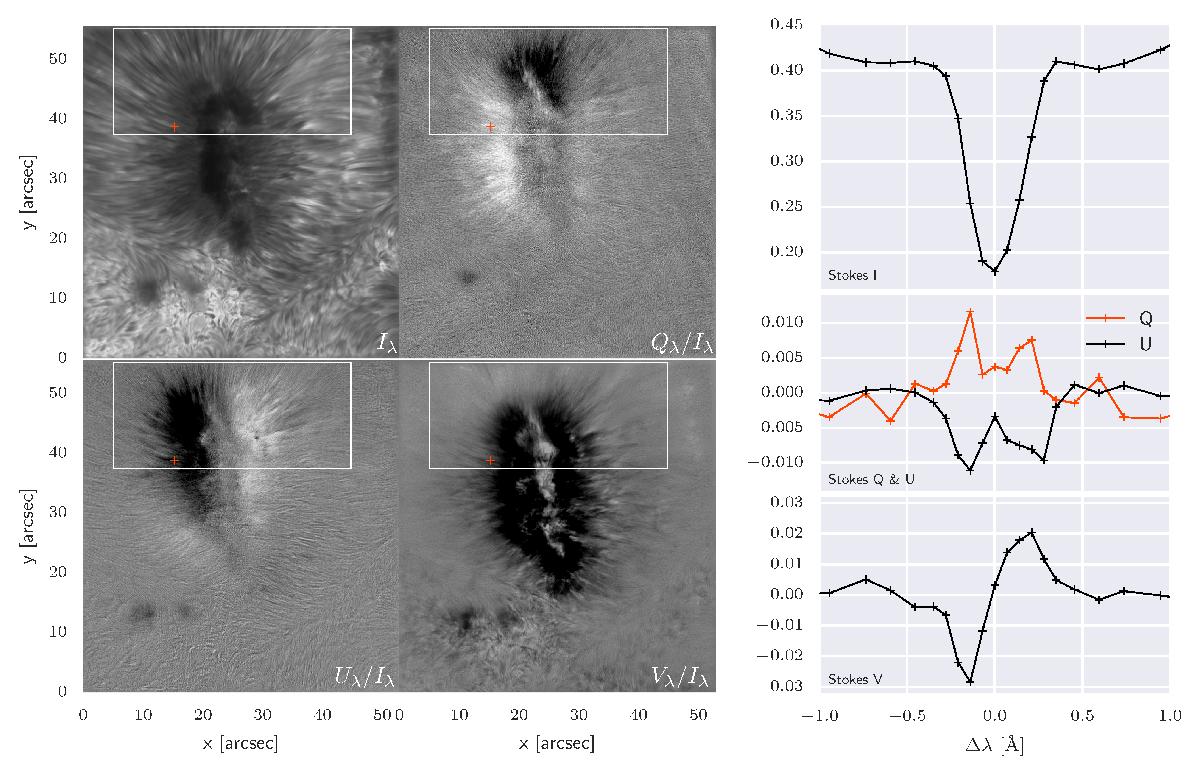
Left: clockwise the panels show Stokes I, Q, U and V images at Δλ = −140 mÅ from line center in the Ca ii 8542 line for the observation of the penumbra. The analysis has been carried out in the subfield indicated with a white rectangle. Right: full-Stokes spectra corresponding to the pixel indicated with a red marker in the FOV.
Current usage metrics show cumulative count of Article Views (full-text article views including HTML views, PDF and ePub downloads, according to the available data) and Abstracts Views on Vision4Press platform.
Data correspond to usage on the plateform after 2015. The current usage metrics is available 48-96 hours after online publication and is updated daily on week days.
Initial download of the metrics may take a while.