Fig. 2
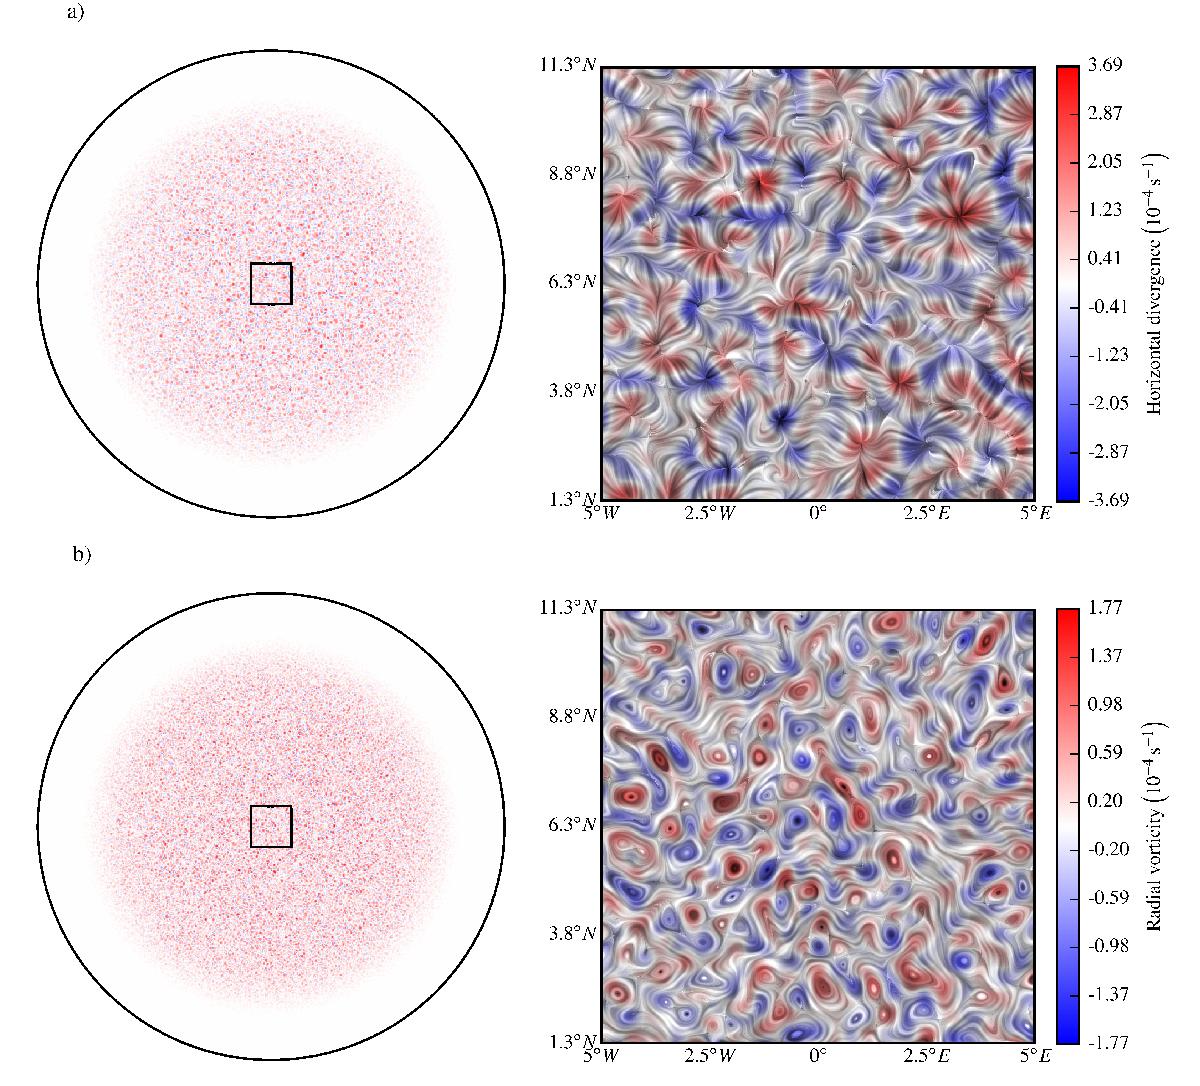
a)Left: quasi-full-disc map of the horizontal divergence ![]() (color contours) of the 30-min-averaged horizontal surface velocity field at 14:00:00 UTC, apodized beyond 60° from the disc center. Right: local map at the disc center of the divergence field convolved by horizontal-flow Lagrangian trajectories using a line-integral convolution visualization technique. The map in the right panel is a zoom on the square patch in the left panel. b) Left: quasi-full-disc map of the vertical vorticity
(color contours) of the 30-min-averaged horizontal surface velocity field at 14:00:00 UTC, apodized beyond 60° from the disc center. Right: local map at the disc center of the divergence field convolved by horizontal-flow Lagrangian trajectories using a line-integral convolution visualization technique. The map in the right panel is a zoom on the square patch in the left panel. b) Left: quasi-full-disc map of the vertical vorticity ![]() (color contours) of the 30-min-averaged horizontal surface velocity field at 14:00:00 UTC, apodized beyond 60° from the disc center. Right: local map at the disc center of the same vorticity field convolved by Lagrangian trajectories computed from the vortical part of the horizontal flow only (the same line-integral convolution visualization technique is used). The map in the right panel is a zoom on the square patch in the left panel.
(color contours) of the 30-min-averaged horizontal surface velocity field at 14:00:00 UTC, apodized beyond 60° from the disc center. Right: local map at the disc center of the same vorticity field convolved by Lagrangian trajectories computed from the vortical part of the horizontal flow only (the same line-integral convolution visualization technique is used). The map in the right panel is a zoom on the square patch in the left panel.
Current usage metrics show cumulative count of Article Views (full-text article views including HTML views, PDF and ePub downloads, according to the available data) and Abstracts Views on Vision4Press platform.
Data correspond to usage on the plateform after 2015. The current usage metrics is available 48-96 hours after online publication and is updated daily on week days.
Initial download of the metrics may take a while.