Fig. 8
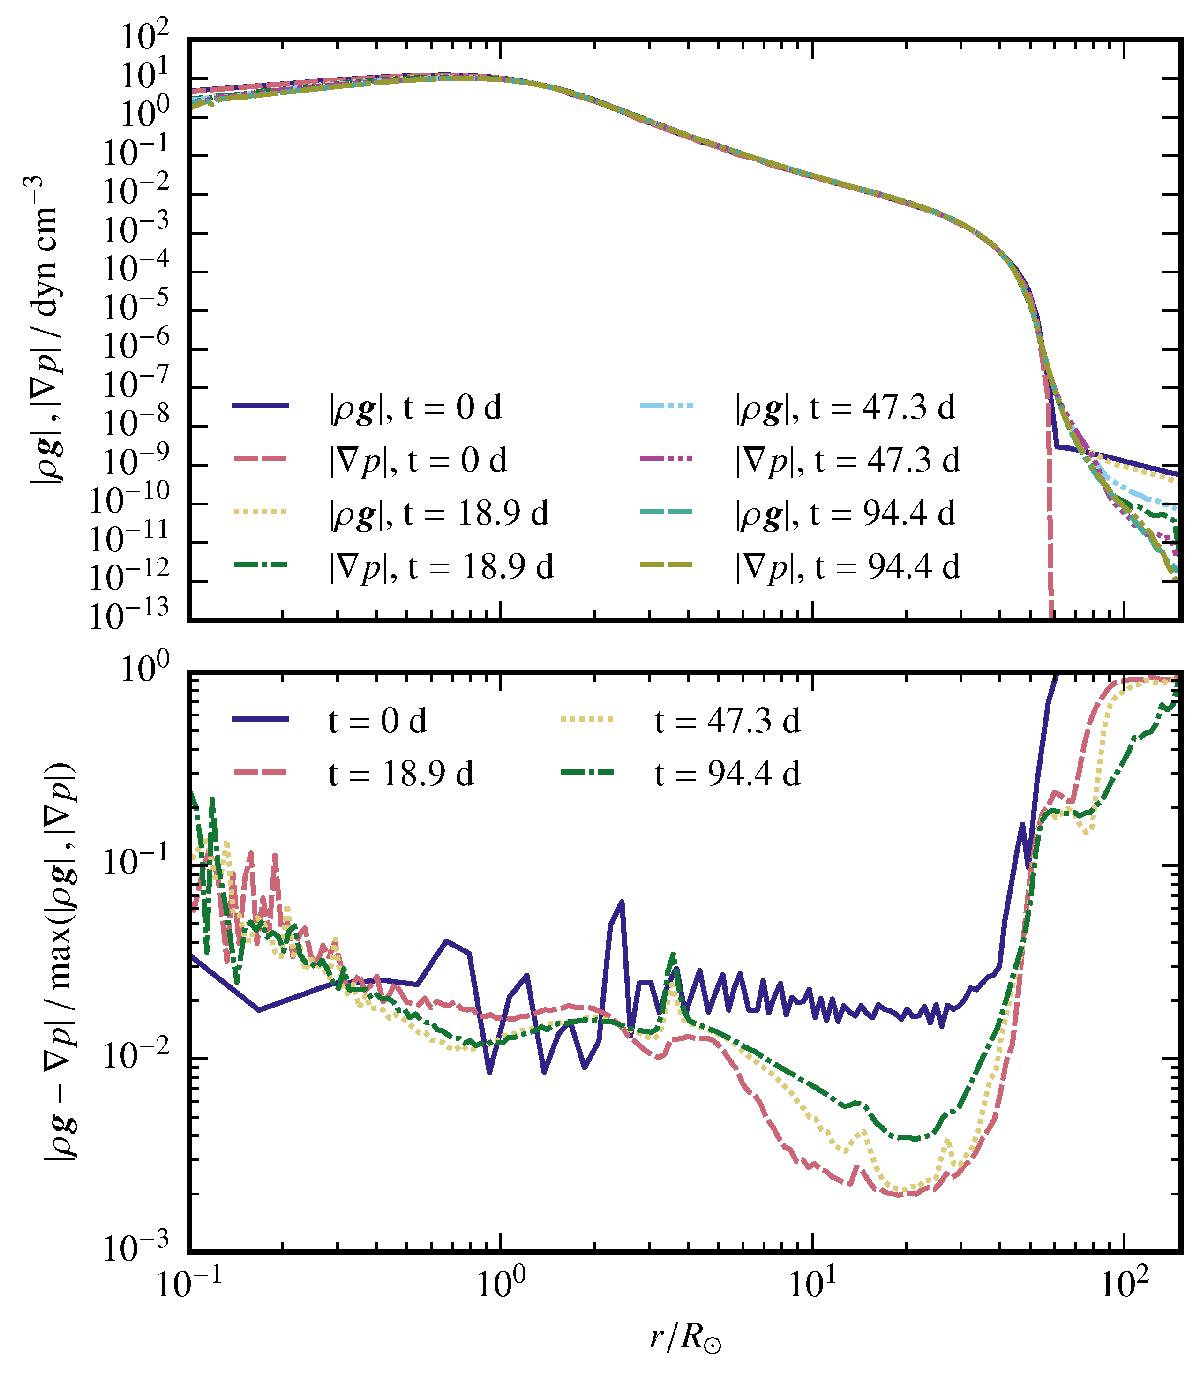
Hydrostatic equilibrium for model H. The top panel shows the two sides of the hydrostatic equilibrium, |∇p| and ρ|g| at different times during the relaxation run. The bottom panel shows the relative error in the hydrostatic equilibrium. All quantities were radially binned and averaged in shells. This model should be convectively stable.
Current usage metrics show cumulative count of Article Views (full-text article views including HTML views, PDF and ePub downloads, according to the available data) and Abstracts Views on Vision4Press platform.
Data correspond to usage on the plateform after 2015. The current usage metrics is available 48-96 hours after online publication and is updated daily on week days.
Initial download of the metrics may take a while.