Fig. 7
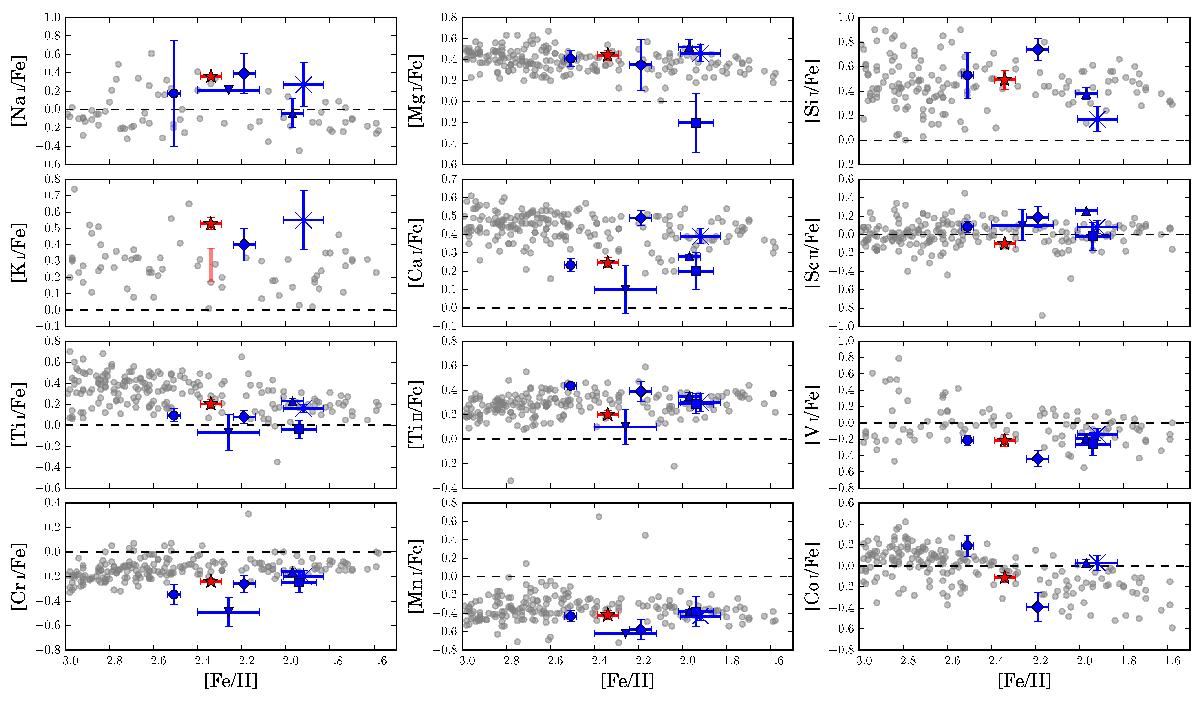
Mean results and scatter for [X/Fe] for all species detected with 11 ≤ Z ≤ 27. NGC 6426 (this study) is represented by red stars. For the case of K, the red bar indicates the region where [K/Fe] is to be expected after an NLTE correction. The gray points resemble the compilation of abundances of stars in the MW halo by Roederer et al. (2014) in the range −3 dex ≤ [Fe/H] ≤−1.5 dex. We also include (in blue) the mean abundances of the similarly metal-poor GCs NGC 5897 (crosses, Koch & McWilliam 2014), NGC 4833 (diamonds, Roederer & Thompson 2015), NGC 5824 (squares, Roederer et al. 2016), M15 (filled circles, RGB targets of Sobeck et al. 2011), NGC 5634 and NGC 5053 (up and down triangles, Sbordone et al. 2015).
Current usage metrics show cumulative count of Article Views (full-text article views including HTML views, PDF and ePub downloads, according to the available data) and Abstracts Views on Vision4Press platform.
Data correspond to usage on the plateform after 2015. The current usage metrics is available 48-96 hours after online publication and is updated daily on week days.
Initial download of the metrics may take a while.