Fig. 5
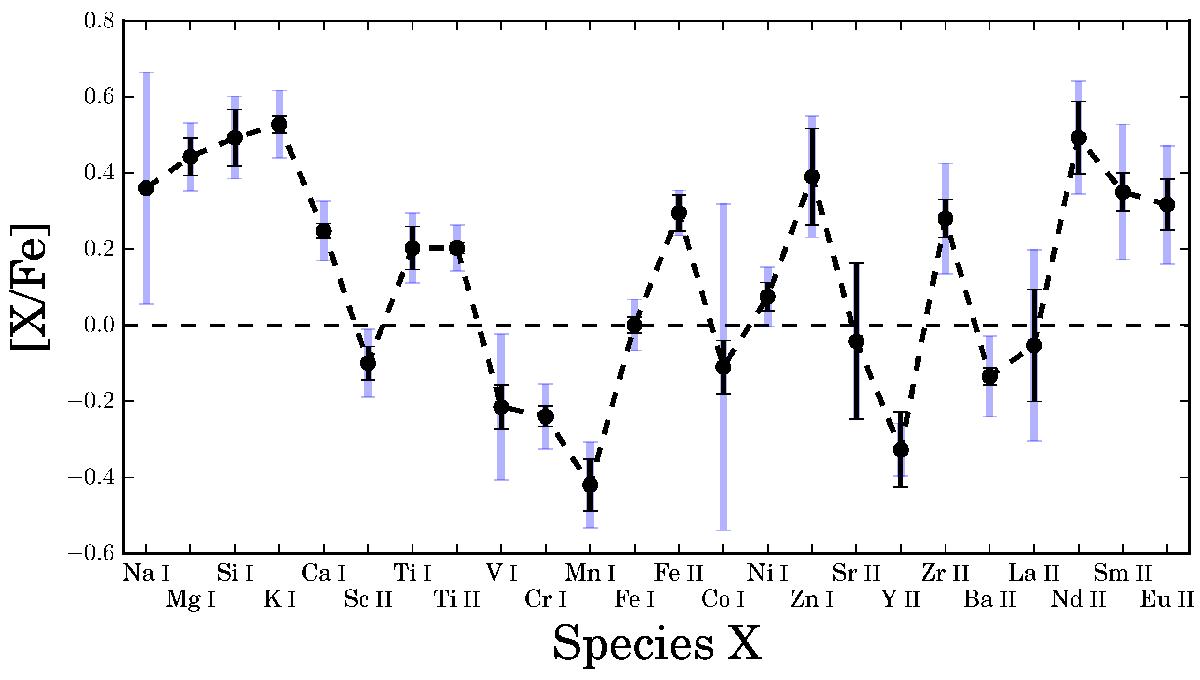
Mean abundance results of all elements analyzed in this study. All ratios of neutral and ionized species are scaled to their Fe counterpart. The only exceptions made are Fe i and Fe ii, which are given with respect to the cluster mean and Fe i abundances, respectively. The black error bars indicate the rms scatter around the mean, while the light blue error bars represent the mean σtot including stellar parameter uncertainties.
Current usage metrics show cumulative count of Article Views (full-text article views including HTML views, PDF and ePub downloads, according to the available data) and Abstracts Views on Vision4Press platform.
Data correspond to usage on the plateform after 2015. The current usage metrics is available 48-96 hours after online publication and is updated daily on week days.
Initial download of the metrics may take a while.