Fig. 3
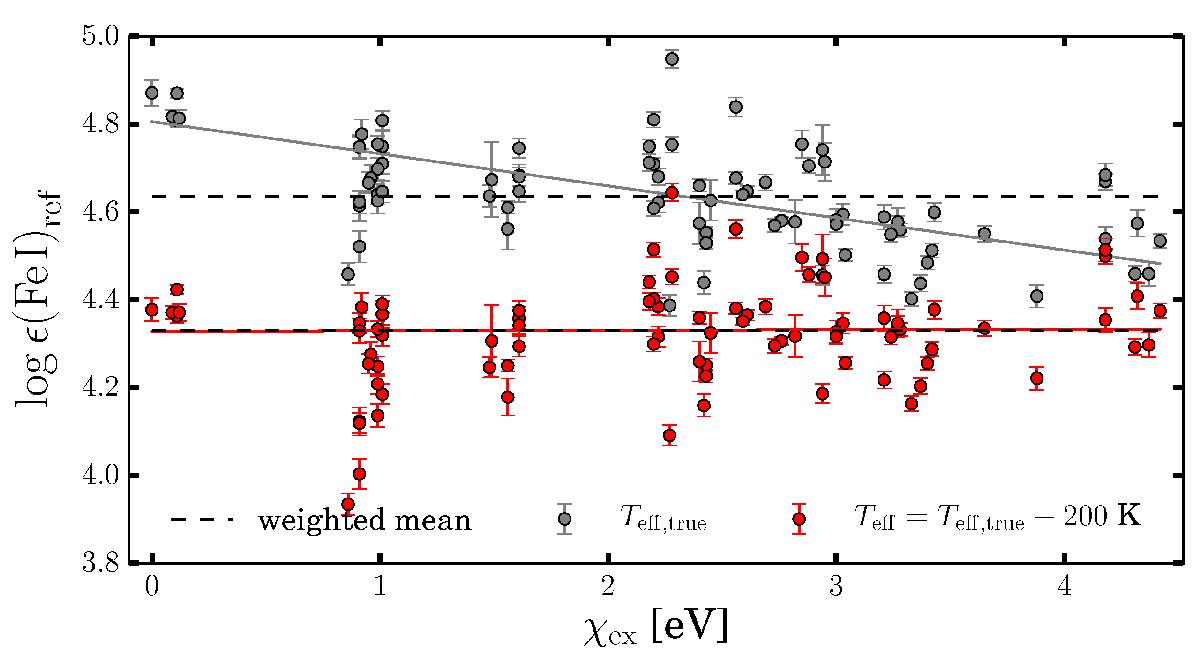
Absolute iron abundance trends with excitation potential χex of Fe i lines in HD 122563 for the reference effective temperature (Teff,true = 4587 K, gray points) and the one that satisfies excitation equilibrium best (Teff = 4387 K, red points). Error bars are the results of propagating σEW,tot through the abundance analysis. The weighted means for each realization are represented by the black dashed lines.
Current usage metrics show cumulative count of Article Views (full-text article views including HTML views, PDF and ePub downloads, according to the available data) and Abstracts Views on Vision4Press platform.
Data correspond to usage on the plateform after 2015. The current usage metrics is available 48-96 hours after online publication and is updated daily on week days.
Initial download of the metrics may take a while.