Fig. 2
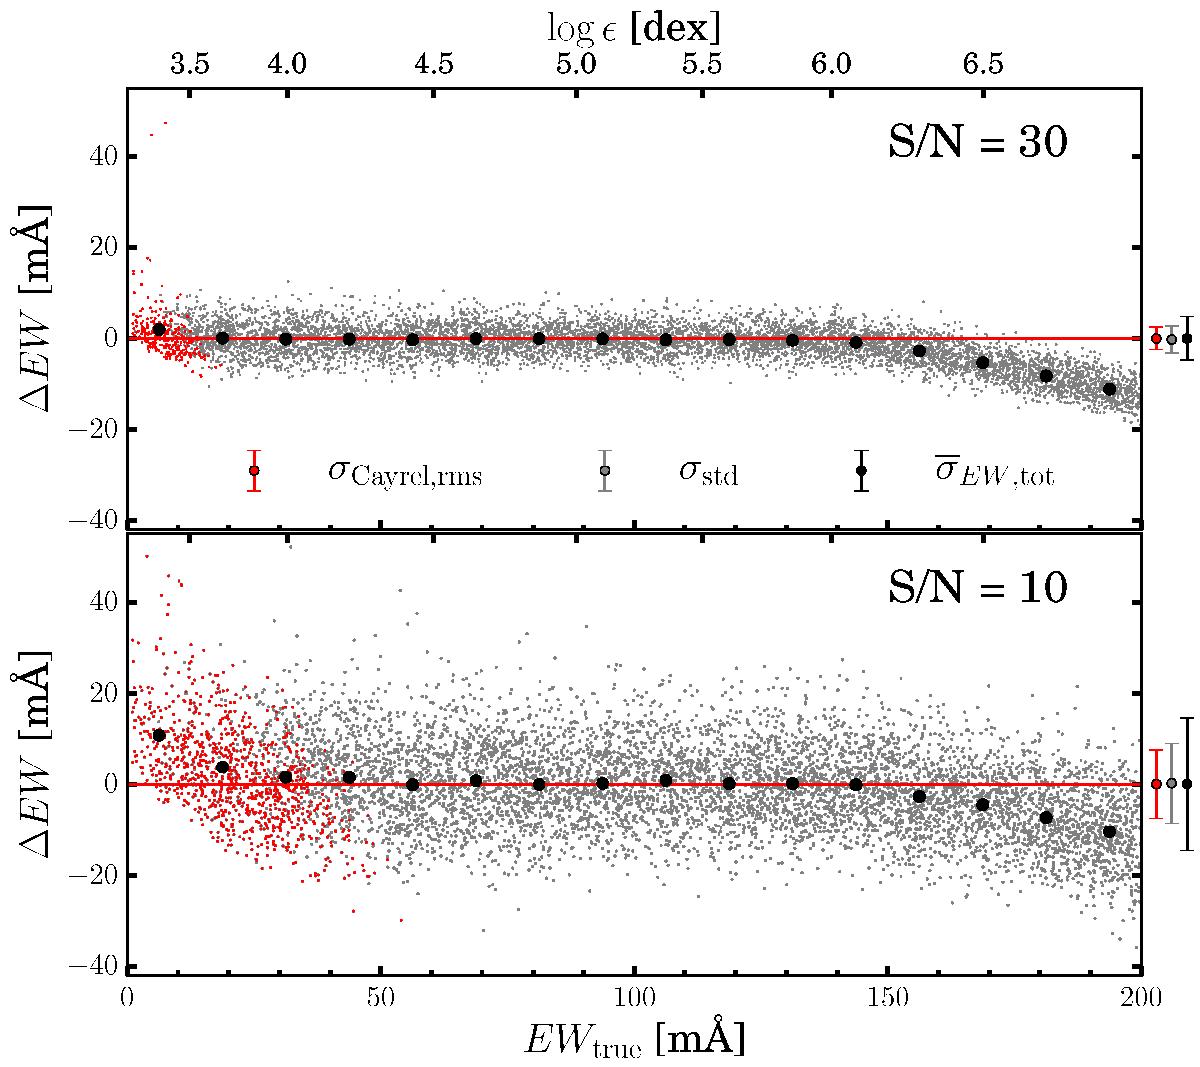
Residuals of measured and true equivalent widths ΔEW for S/N of 30 pixel-1 (top panel) and 10 pixel -1 (lower panel). Measurements which were already rejected within EWCODE are shown as red dots. Thick black points indicate the means of the respective EW bins. Red, gray and black error bars illustrate the theoretical and true rms scatters within the trust region (see text) and the error provided by EWCODE, respectively. The corresponding abundance for this particular synthesized transition (see text) for a given EWtrue is indicated by the top axis.
Current usage metrics show cumulative count of Article Views (full-text article views including HTML views, PDF and ePub downloads, according to the available data) and Abstracts Views on Vision4Press platform.
Data correspond to usage on the plateform after 2015. The current usage metrics is available 48-96 hours after online publication and is updated daily on week days.
Initial download of the metrics may take a while.