Fig. 12
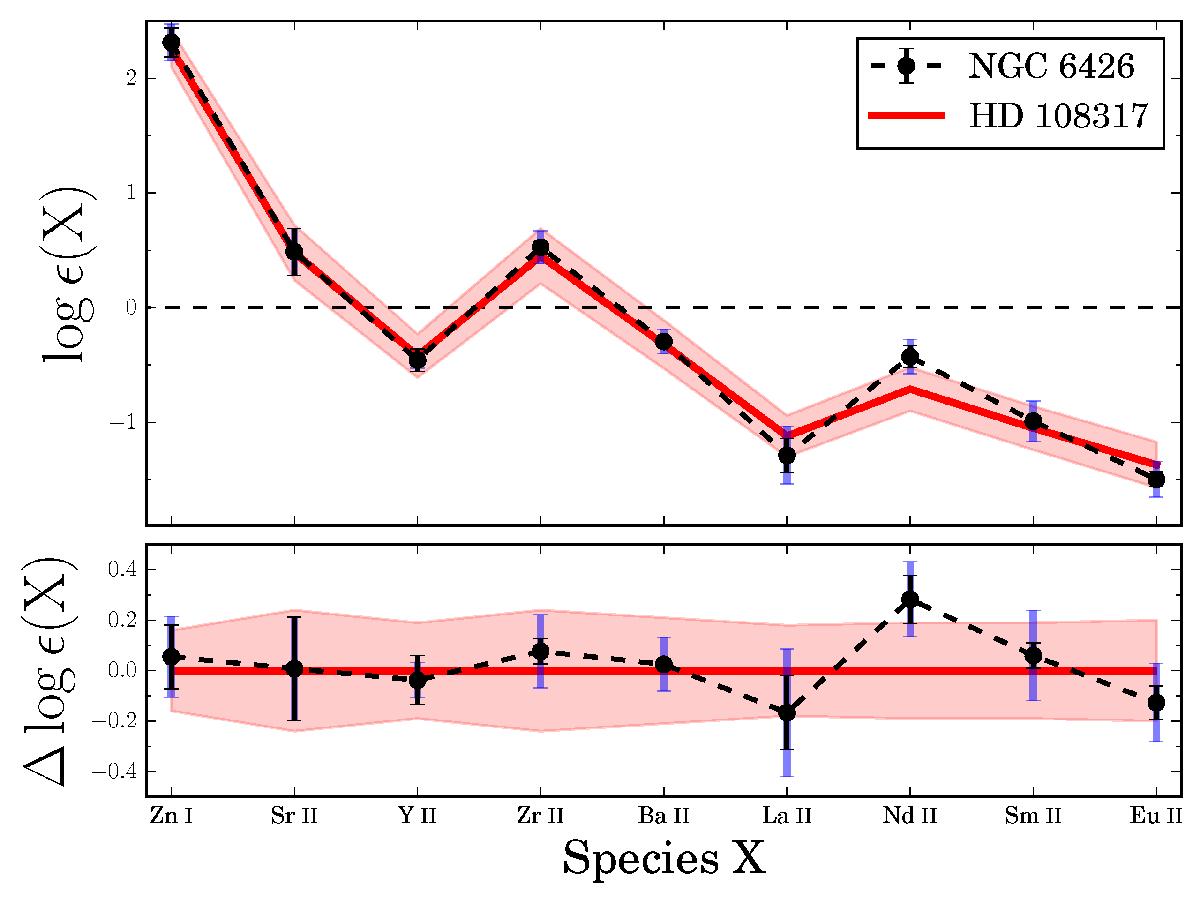
Top panel: mean abundance pattern for NGC 6426. The color coding is the same as in Fig. 5. The red line and red shaded region state the abundances and uncertainties of HD 108317 as derived by Roederer et al. (2012). Both patterns are unscaled, i.e., represent their original values. Bottom panel: residual pattern for the cluster stars after subtracting HD 108317.
Current usage metrics show cumulative count of Article Views (full-text article views including HTML views, PDF and ePub downloads, according to the available data) and Abstracts Views on Vision4Press platform.
Data correspond to usage on the plateform after 2015. The current usage metrics is available 48-96 hours after online publication and is updated daily on week days.
Initial download of the metrics may take a while.