Free Access
Fig. 10
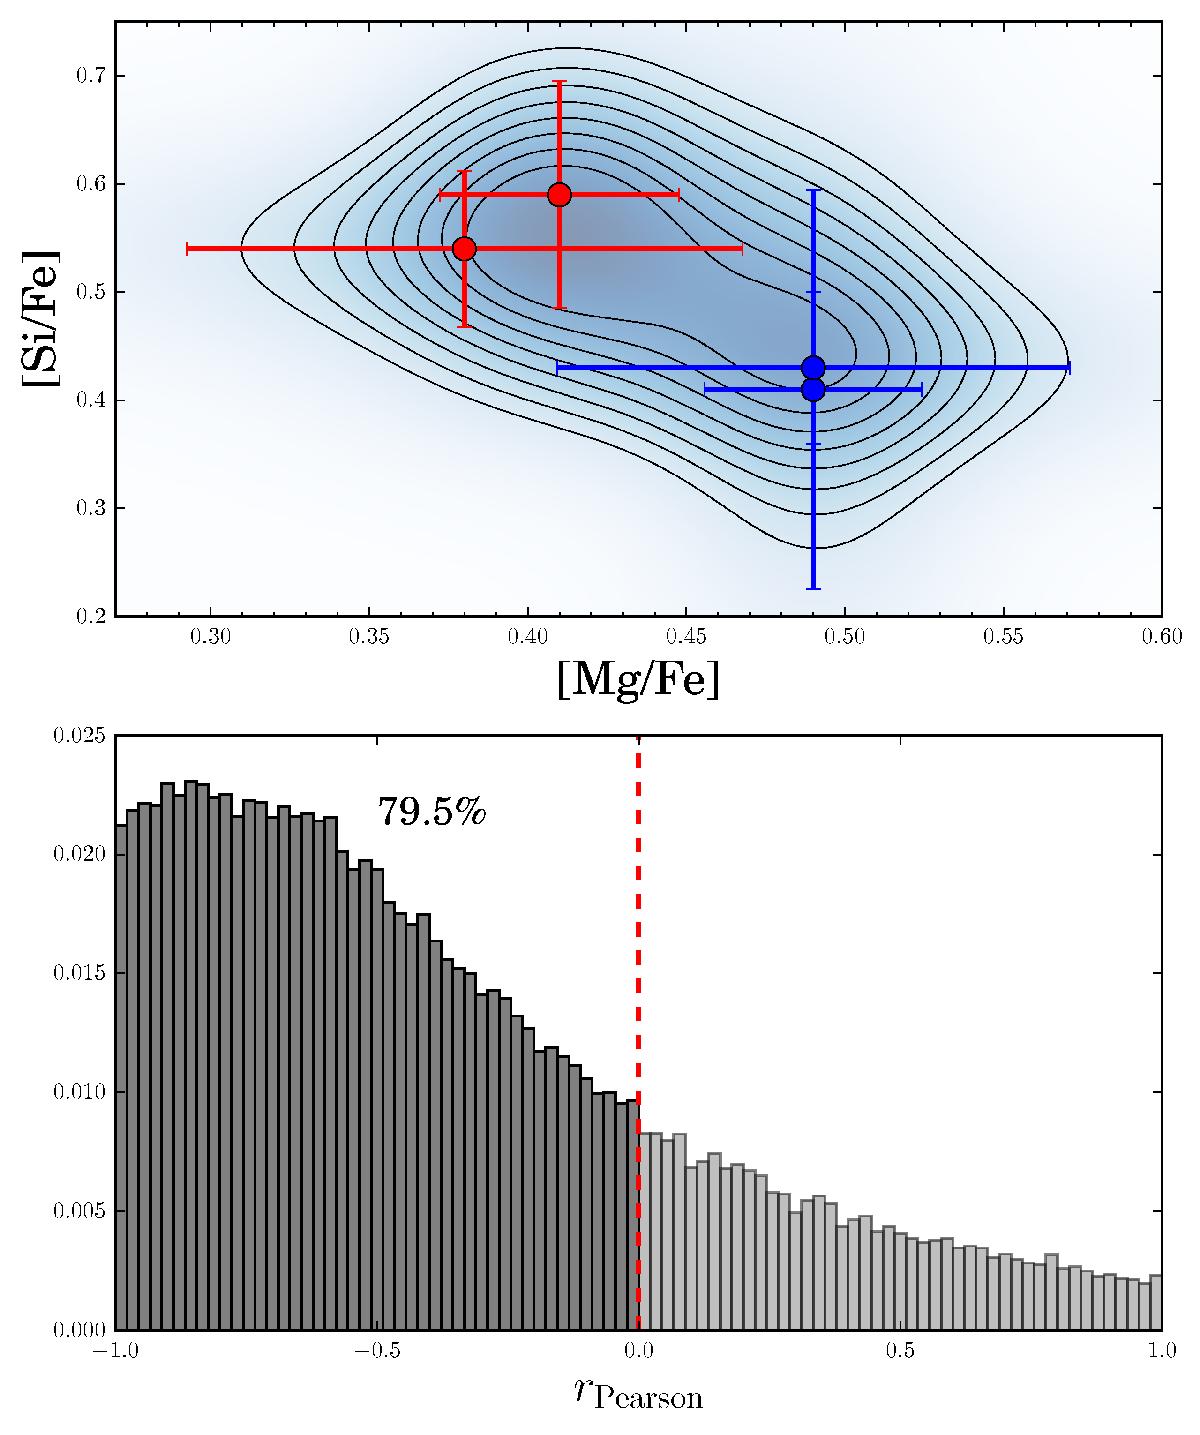
Top: abundance results for Si and Mg. Color coding is the same as in Fig. 6. The contours show the smoothed distribution, which was used in order to evaluate the significance of the correlation. Bottom: discrete probability distribution of the correlation coefficients for the 105 realizations.
Current usage metrics show cumulative count of Article Views (full-text article views including HTML views, PDF and ePub downloads, according to the available data) and Abstracts Views on Vision4Press platform.
Data correspond to usage on the plateform after 2015. The current usage metrics is available 48-96 hours after online publication and is updated daily on week days.
Initial download of the metrics may take a while.