Fig. 9
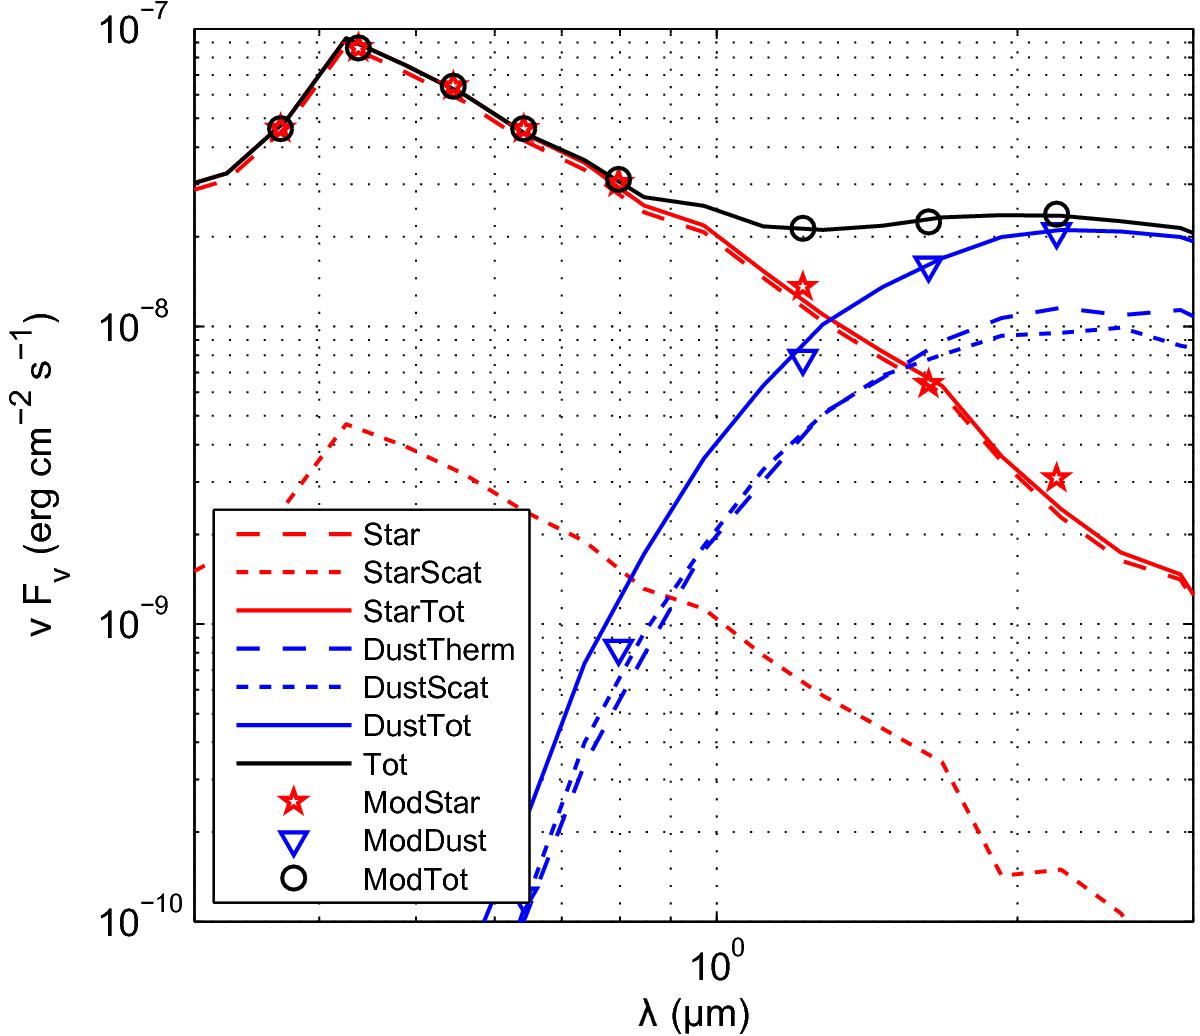
Sample fit of a model SED (A1c) obtained with the MCFOST program. The lines show various contributions to the SED of the MCFOST model: direct thermal radiation (dash); diffusion (dash-dot); total (continuous) for either the stellar or the dust contributions. The symbols show the equivalent flux values in the eight photometric bands (U,...,K) for the fitted star+dust model. A model with a single blackbody for the dust appears to provide an acceptable fit to the near-infrared spectrum, even though the emitting dust spans a range of temperatures.
Current usage metrics show cumulative count of Article Views (full-text article views including HTML views, PDF and ePub downloads, according to the available data) and Abstracts Views on Vision4Press platform.
Data correspond to usage on the plateform after 2015. The current usage metrics is available 48-96 hours after online publication and is updated daily on week days.
Initial download of the metrics may take a while.