Free Access
Fig. 8
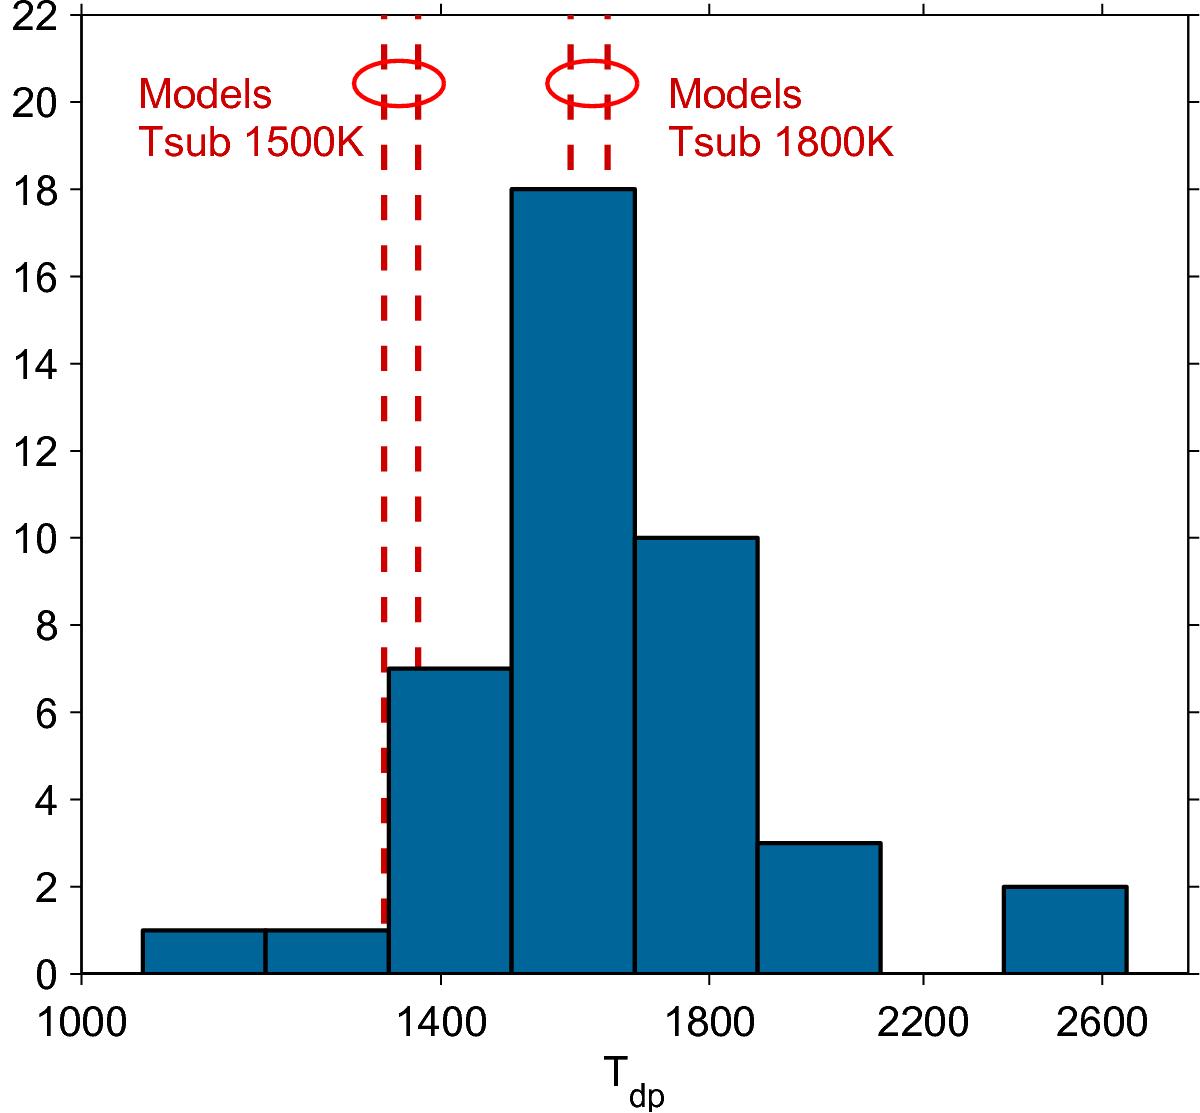
Histogram of Tdp (log scale) derived from fits to photometric data, restricted to non-binary objects having a fractional contribution of the dust to the H-band flux fd ≥ 0.1. Dashed lines: values of Tdp obtained when fitting, with same procedure, models with sublimation temperature 1500K or 1800K; see text and Table 9.
Current usage metrics show cumulative count of Article Views (full-text article views including HTML views, PDF and ePub downloads, according to the available data) and Abstracts Views on Vision4Press platform.
Data correspond to usage on the plateform after 2015. The current usage metrics is available 48-96 hours after online publication and is updated daily on week days.
Initial download of the metrics may take a while.