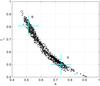
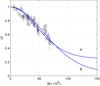
Fig. 4
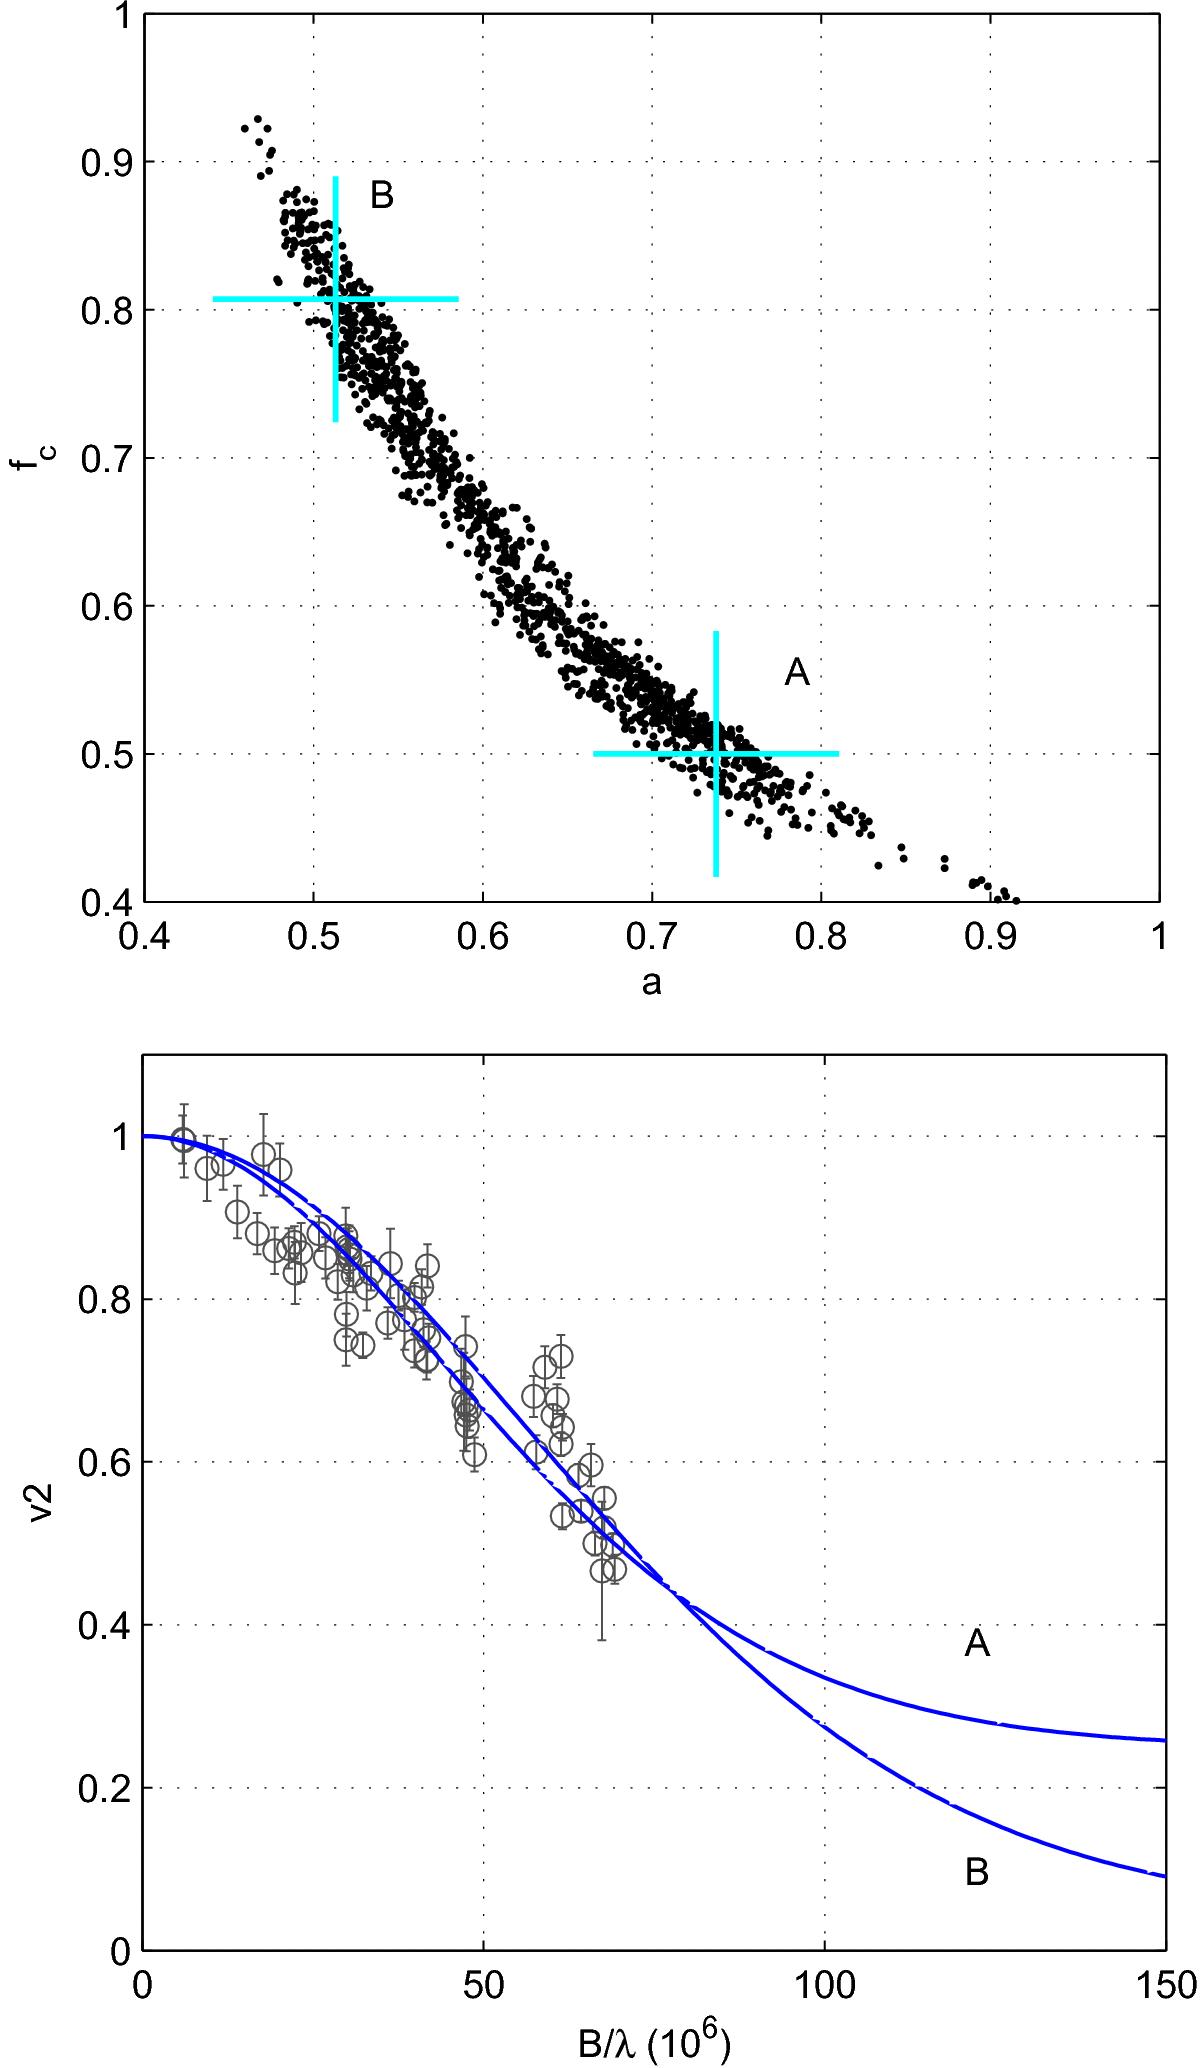
Illustrating, in the case of HD 85567, the degeneracy that arises when fitting a simple model (star+circumstellar) to interferometric visibility data. Top panel: radius a and flux fraction fc (in the MCMC chain) of the circumstellar component, crosses labeled A and B mark the 10% and 90% points in the respective marginal distributions. Bottom panel: observed data for V2 (middle spectral channel only), and visibility profiles for (isotropic) Gaussians with the parameters at points A and B respectively.
Current usage metrics show cumulative count of Article Views (full-text article views including HTML views, PDF and ePub downloads, according to the available data) and Abstracts Views on Vision4Press platform.
Data correspond to usage on the plateform after 2015. The current usage metrics is available 48-96 hours after online publication and is updated daily on week days.
Initial download of the metrics may take a while.