Free Access
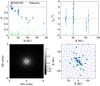
Fig. D.2
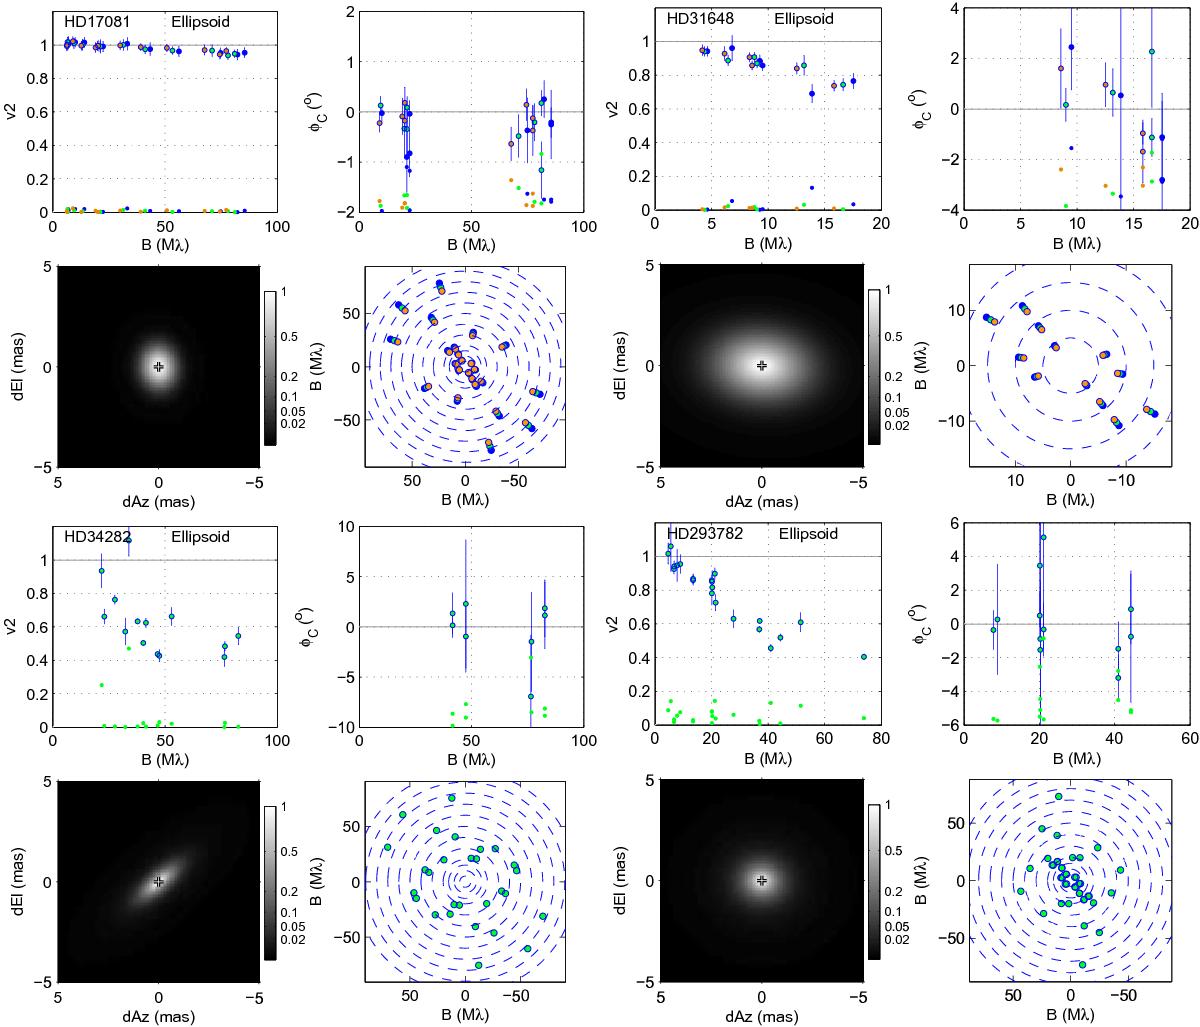
Summary plots for the non-HQ objects. Similar plots to those in Fig. D.1 above, for the rest of the sample. For these objects, because of the limited resolution achieved or other limitations, a simpler Ellipsoid fit was made. For objects tagged as binary, no fit was attempted, and the image sub-panel is absent.
This figure is made of several images, please see below:
Current usage metrics show cumulative count of Article Views (full-text article views including HTML views, PDF and ePub downloads, according to the available data) and Abstracts Views on Vision4Press platform.
Data correspond to usage on the plateform after 2015. The current usage metrics is available 48-96 hours after online publication and is updated daily on week days.
Initial download of the metrics may take a while.