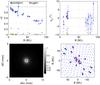
Fig. D.1
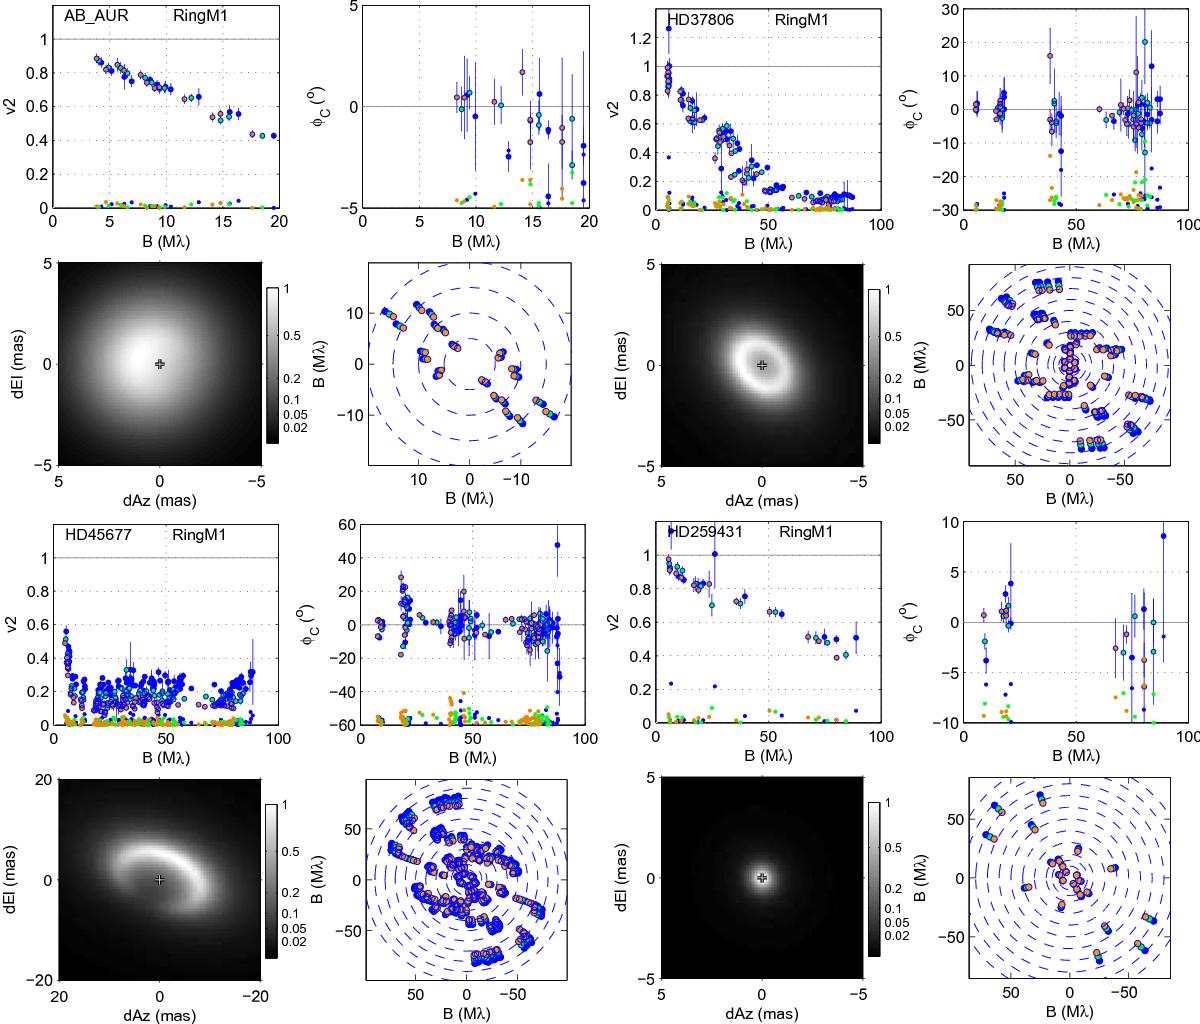
Summary plots for the HQ objects. Four panels are shown for each object: (1) visibility squared V2 versus projected baseline in units of 106λ; (2) phase closure φcp versus the largest projected baseline of each triangle; (3) a halftone image of the circumstellar component resulting from a Ring fit with m = 1 azimuthal modulation, the star’s position is shown by a cross symbol; (4) the (uv) plane coverage. For spectrally dispersed observations, the red, green, blue colors represent wavelengths from longest to shortest. For the V2 and φcp plots, the absolute value of the fit residuals is shown by the dots at the bottom of the plot.
Current usage metrics show cumulative count of Article Views (full-text article views including HTML views, PDF and ePub downloads, according to the available data) and Abstracts Views on Vision4Press platform.
Data correspond to usage on the plateform after 2015. The current usage metrics is available 48-96 hours after online publication and is updated daily on week days.
Initial download of the metrics may take a while.