Fig. 15
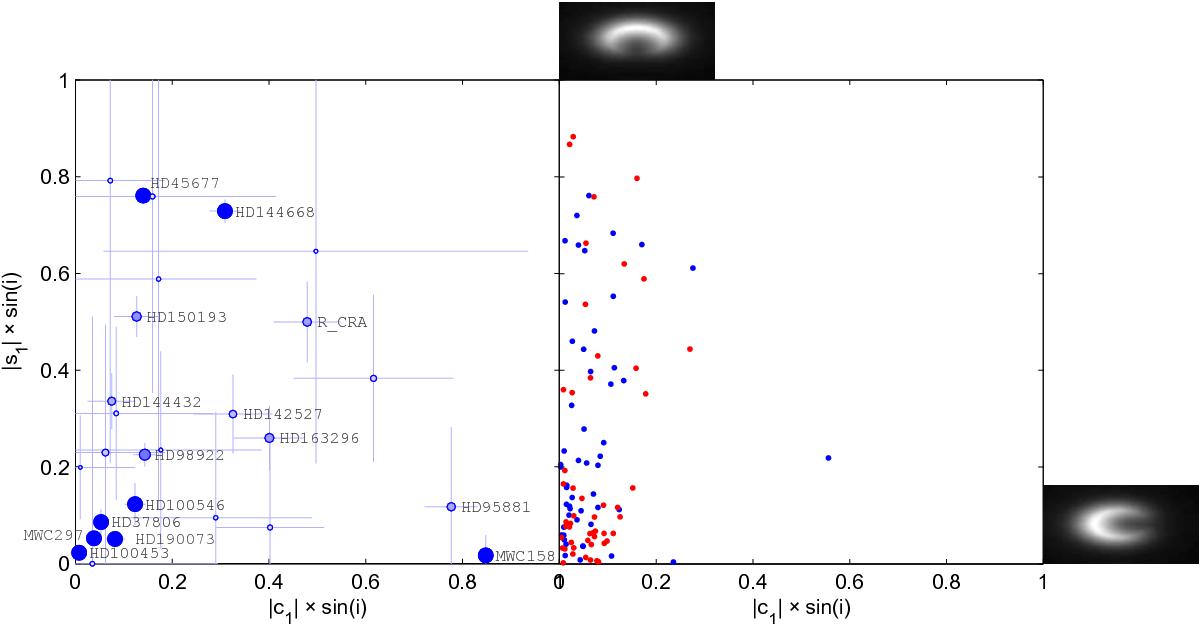
Left: Cartesian plot of the azimuthal modulation parameters for the HQ objects. The size of the symbols varies with the quality (small error bars) of the data; objects above a set quality level are labeled with their name. Right: similar diagram for models in_A0 (blue) and thm_A0 (red); a cutoff cosi ≥ 0.45 has been applied, similar to what is observed in actual observations. As a visual reminder, two thumbnail images of models are shown along the corresponding axes.
Current usage metrics show cumulative count of Article Views (full-text article views including HTML views, PDF and ePub downloads, according to the available data) and Abstracts Views on Vision4Press platform.
Data correspond to usage on the plateform after 2015. The current usage metrics is available 48-96 hours after online publication and is updated daily on week days.
Initial download of the metrics may take a while.