Fig. 11
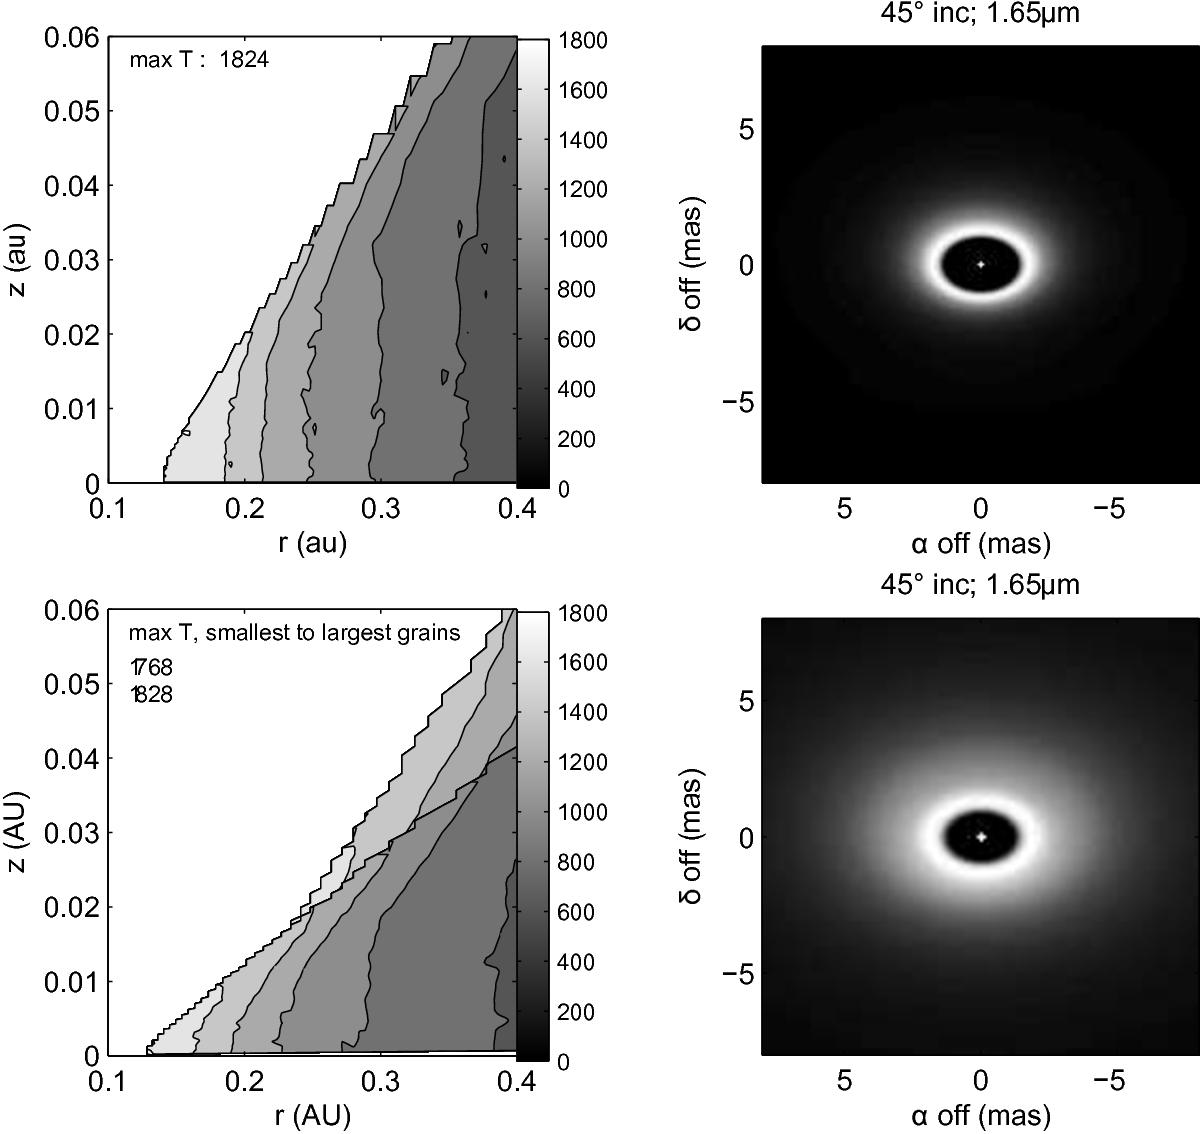
Graphical summary of models IN (above) and THM (below). Left: temperature profiles; in the case of the THM model, the temperature distributions for large grains is overlaid onto that for small grains. Right: sky images at λ = 1.65 μm, i = 45°; a mild enhancement of low brightness regions has been realized by a square root scaling. The angular scale is for the object located at a distance of 100 parsecs.
Current usage metrics show cumulative count of Article Views (full-text article views including HTML views, PDF and ePub downloads, according to the available data) and Abstracts Views on Vision4Press platform.
Data correspond to usage on the plateform after 2015. The current usage metrics is available 48-96 hours after online publication and is updated daily on week days.
Initial download of the metrics may take a while.