Free Access
Fig. 6
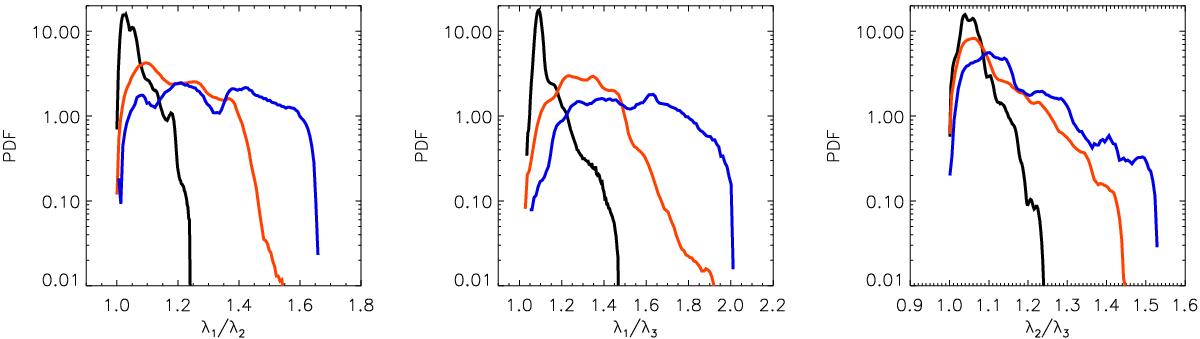
PDF of λ1/λ2 (left), λ1/λ3 (middle) and λ2/λ3 (right) from RUN III at t = 105, computed for three different ranges of values of ϵ, namely 0 ≤ ϵ(t∗) ≤ ϵmax(t∗) / 3 (black curve), ϵmax(t∗) / 3 <ϵ(t∗) ≤ 2ϵmax(t∗) / 3 (red curve) and 2ϵmax(t∗) / 3 ≤ ϵ(t∗) ≤ ϵmax(t∗) (blue curve).
Current usage metrics show cumulative count of Article Views (full-text article views including HTML views, PDF and ePub downloads, according to the available data) and Abstracts Views on Vision4Press platform.
Data correspond to usage on the plateform after 2015. The current usage metrics is available 48-96 hours after online publication and is updated daily on week days.
Initial download of the metrics may take a while.