Fig. 9
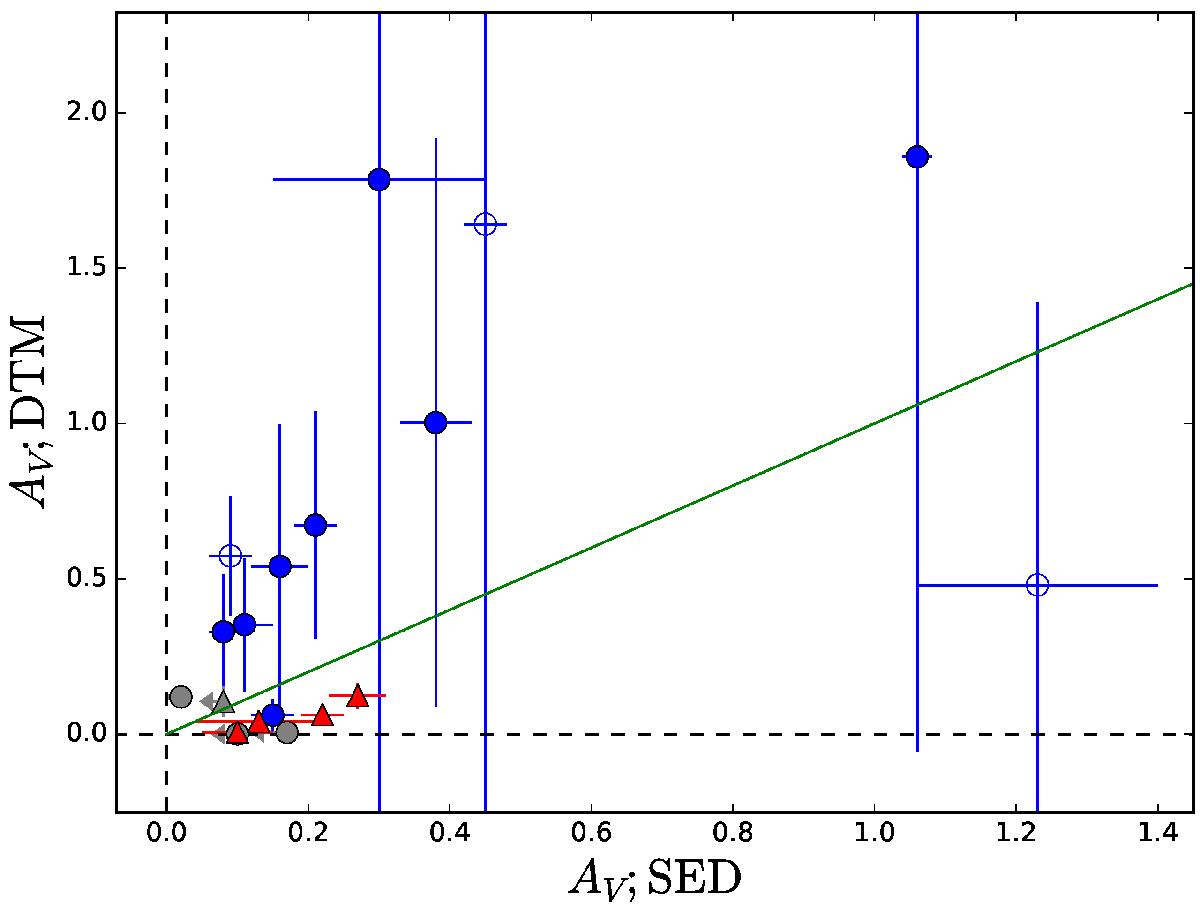
AV as measured directly from the SED against that calculated from the DTM. The green line indicates a 1:1 conversion between the two. Blue circles represent SEDs best fit with a simple power-law, whereas red triangles are used for broken power-law fits. Empty points refer to depletion measured from low-resolution spectra. Large error bars are due to significant errors in several measured parameters being combined in quadrature.
Current usage metrics show cumulative count of Article Views (full-text article views including HTML views, PDF and ePub downloads, according to the available data) and Abstracts Views on Vision4Press platform.
Data correspond to usage on the plateform after 2015. The current usage metrics is available 48-96 hours after online publication and is updated daily on week days.
Initial download of the metrics may take a while.