Fig. 3
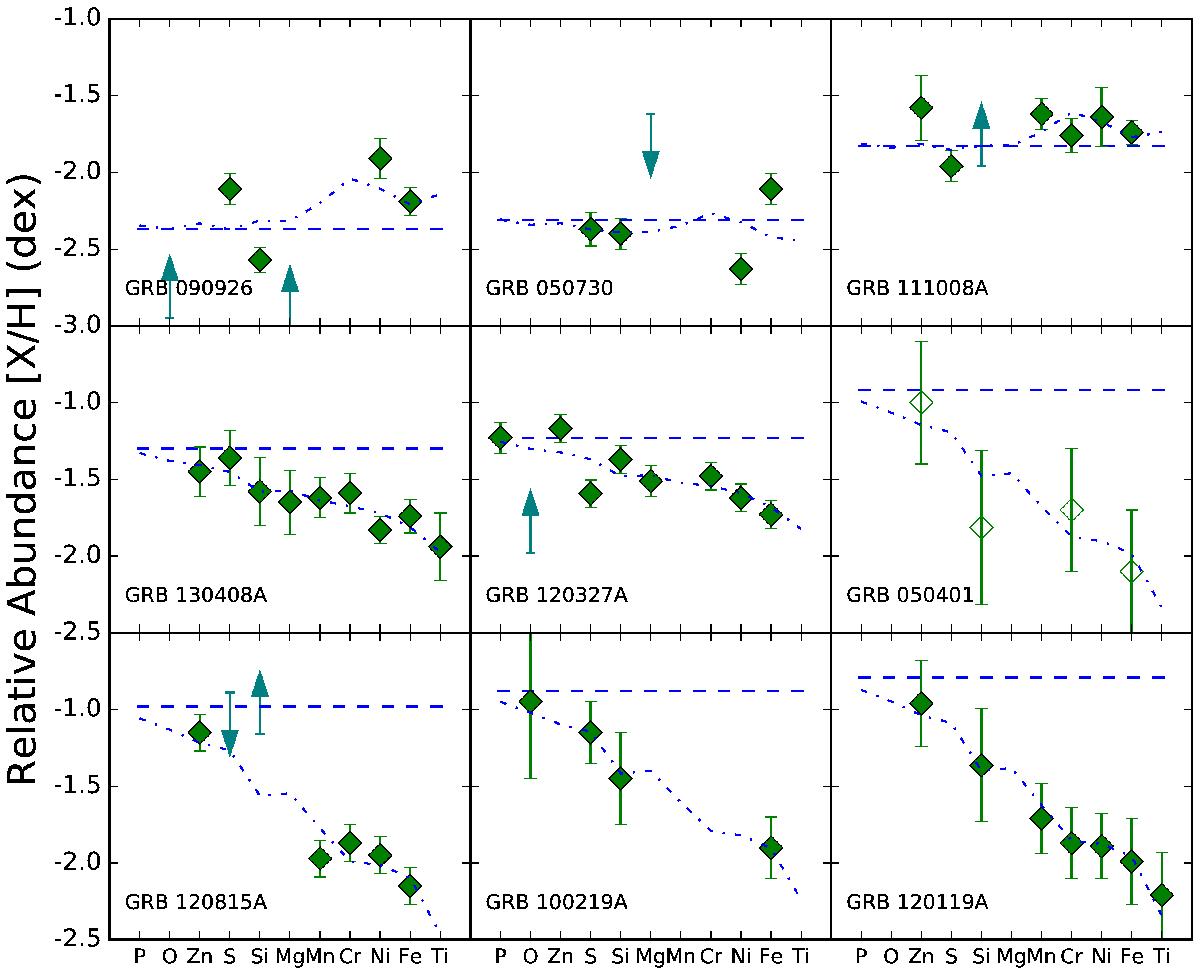
Dust depletion fits for the nine lowest metallicity GRB-DLAs in our sample. The diamond points are the observed relative abundances, the dot-dashed line follows the expected depletion at a strength of the best fit F∗, and the dashed line represents the best fit metallicity. Unfilled markers represent low-resolution spectral data (we continue this in all following plots), and squares with up (down) arrows represent lower (upper) limits.
Current usage metrics show cumulative count of Article Views (full-text article views including HTML views, PDF and ePub downloads, according to the available data) and Abstracts Views on Vision4Press platform.
Data correspond to usage on the plateform after 2015. The current usage metrics is available 48-96 hours after online publication and is updated daily on week days.
Initial download of the metrics may take a while.