Fig. 7
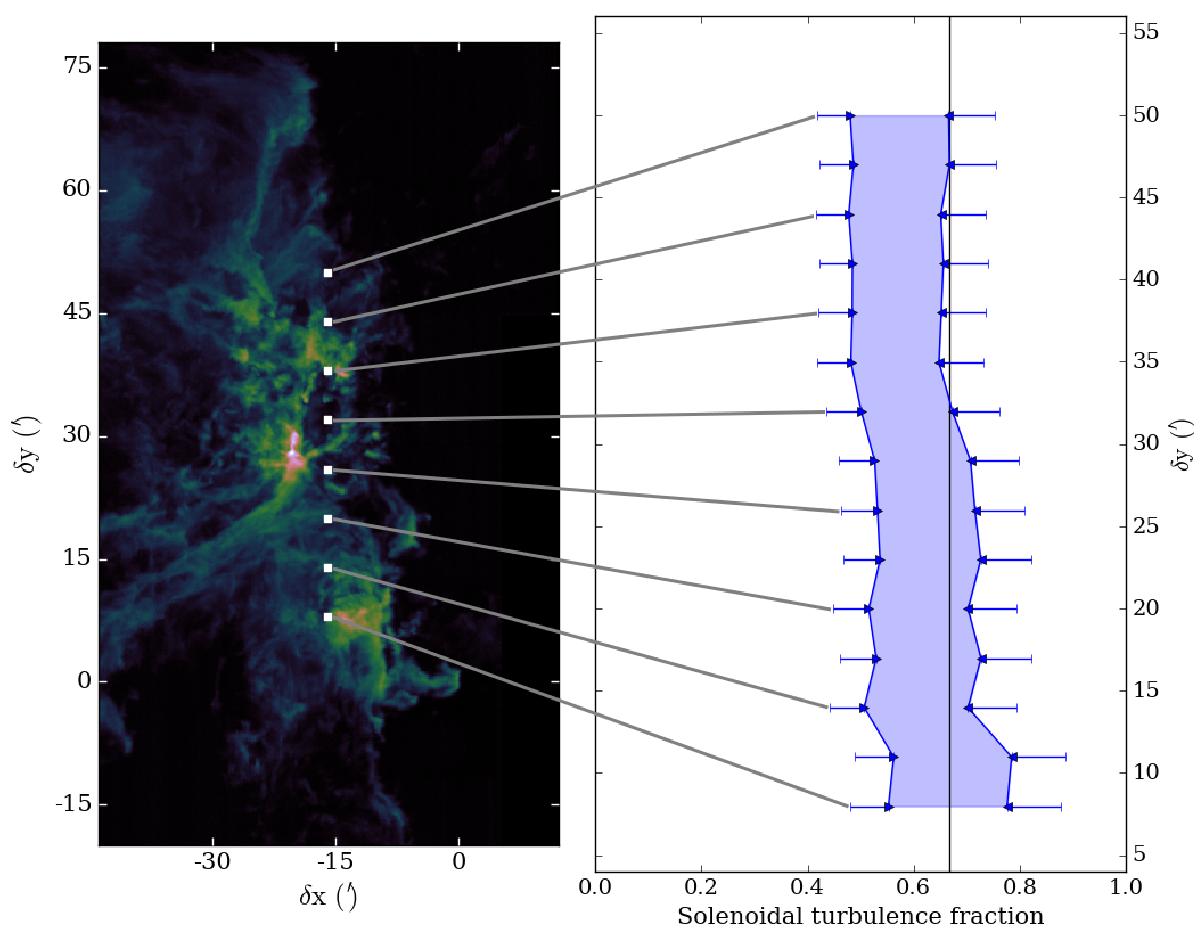
Solenoidal turbulence fraction for sliding square areas with a width equal to the one of the full map (56 arcmin). The shaded area corresponds to the g21 uncertainty, while the error bars show the experimental uncertainties due to observational noise. The vertical line marks the equipartition limit. The map on the left presents the centres of the square areas for which the calculations were performed, superimposed on the 13CO(J = 1−0) Tpeak map.
Current usage metrics show cumulative count of Article Views (full-text article views including HTML views, PDF and ePub downloads, according to the available data) and Abstracts Views on Vision4Press platform.
Data correspond to usage on the plateform after 2015. The current usage metrics is available 48-96 hours after online publication and is updated daily on week days.
Initial download of the metrics may take a while.