Fig. 5
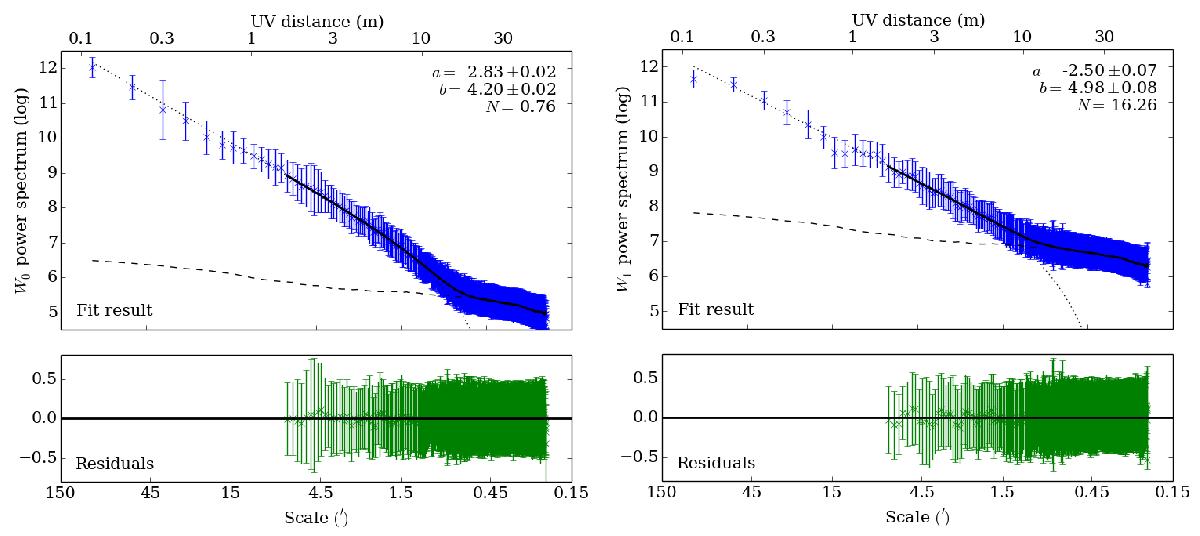
Left: power-law fitting of the W0 power spectrum. Upper panel: data (blue crosses), fit result (thick solid line) plotted over the fitted domain, power law convolved with the Gaussian beam (dotted line) extrapolated to all spatial frequencies, noise model (dashed line). Lower panel: residuals. The scale in the Fourier space is given in UV distance as for interferometric observations, which enables us to visually relate the resolution and the telescope diameter. Right: same results, except for the W1 power spectrum.
Current usage metrics show cumulative count of Article Views (full-text article views including HTML views, PDF and ePub downloads, according to the available data) and Abstracts Views on Vision4Press platform.
Data correspond to usage on the plateform after 2015. The current usage metrics is available 48-96 hours after online publication and is updated daily on week days.
Initial download of the metrics may take a while.