Fig. 3
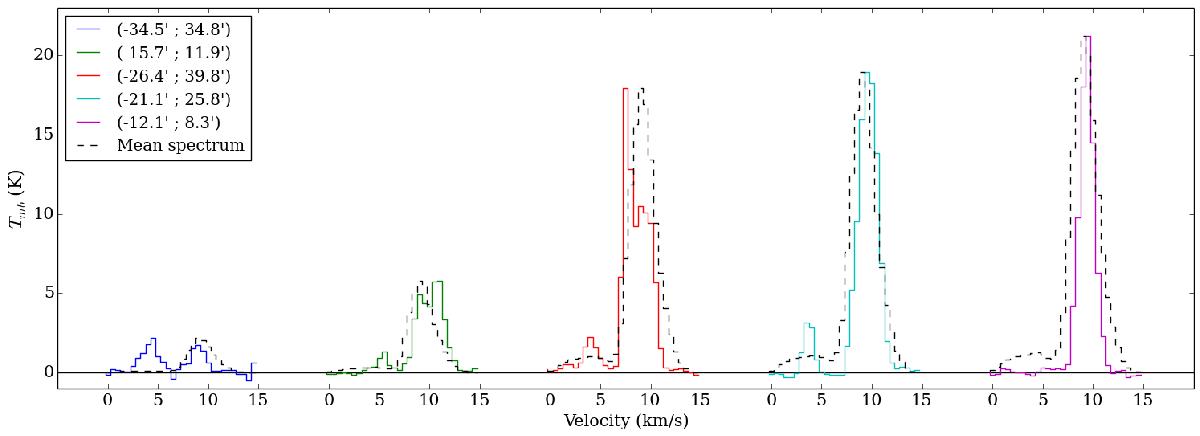
13CO(J = 1−0) spectra along selected lines of sights in the Orion B cloud, showing the diversity of velocity components (up to four per spectrum). The coordinates of the various lines of sights are given in arc-minutes in our custom set of coordinates (δx, δy). The average spectrum for the whole field, normalized to have the same peak temperature, is superimposed with a dashed line for comparison. The positions of the spectra on the map are shown by white squares in the first panel of Fig. 2.
Current usage metrics show cumulative count of Article Views (full-text article views including HTML views, PDF and ePub downloads, according to the available data) and Abstracts Views on Vision4Press platform.
Data correspond to usage on the plateform after 2015. The current usage metrics is available 48-96 hours after online publication and is updated daily on week days.
Initial download of the metrics may take a while.