Fig. 2
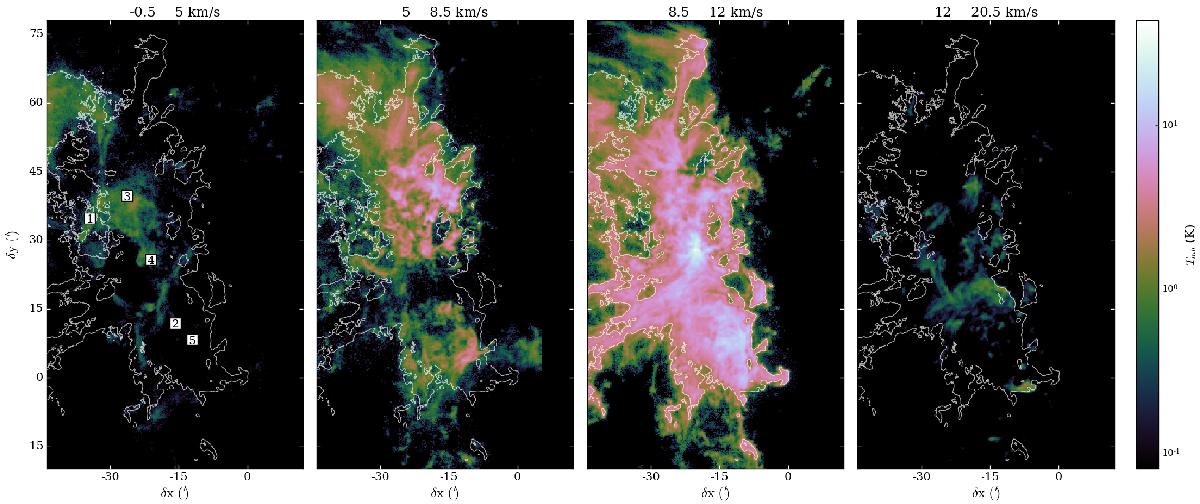
Maps of the average brightness temperature of the 13CO(J = 1−0) line in four contiguous velocity ranges. The main-beam temperature scale is indicated by the color bar on the right. The contour shows the value of 8.9 K km s-1 in the W0 map, corresponding to 0.43 K in the mean temperature map integrated over the −0.5−20.5 km s-1 velocity range. The set of coordinates used for the observational campaign takes the Horsehead PDR as a reference point, and aligns the IC 434 PDR along the vertical axis (14° counter-clockwise rotation with respect to equatorial coordinates). The numbered squares in the first panel show the positions of the spectra presented in Fig. 3, from left to right.
Current usage metrics show cumulative count of Article Views (full-text article views including HTML views, PDF and ePub downloads, according to the available data) and Abstracts Views on Vision4Press platform.
Data correspond to usage on the plateform after 2015. The current usage metrics is available 48-96 hours after online publication and is updated daily on week days.
Initial download of the metrics may take a while.