Fig. A.1
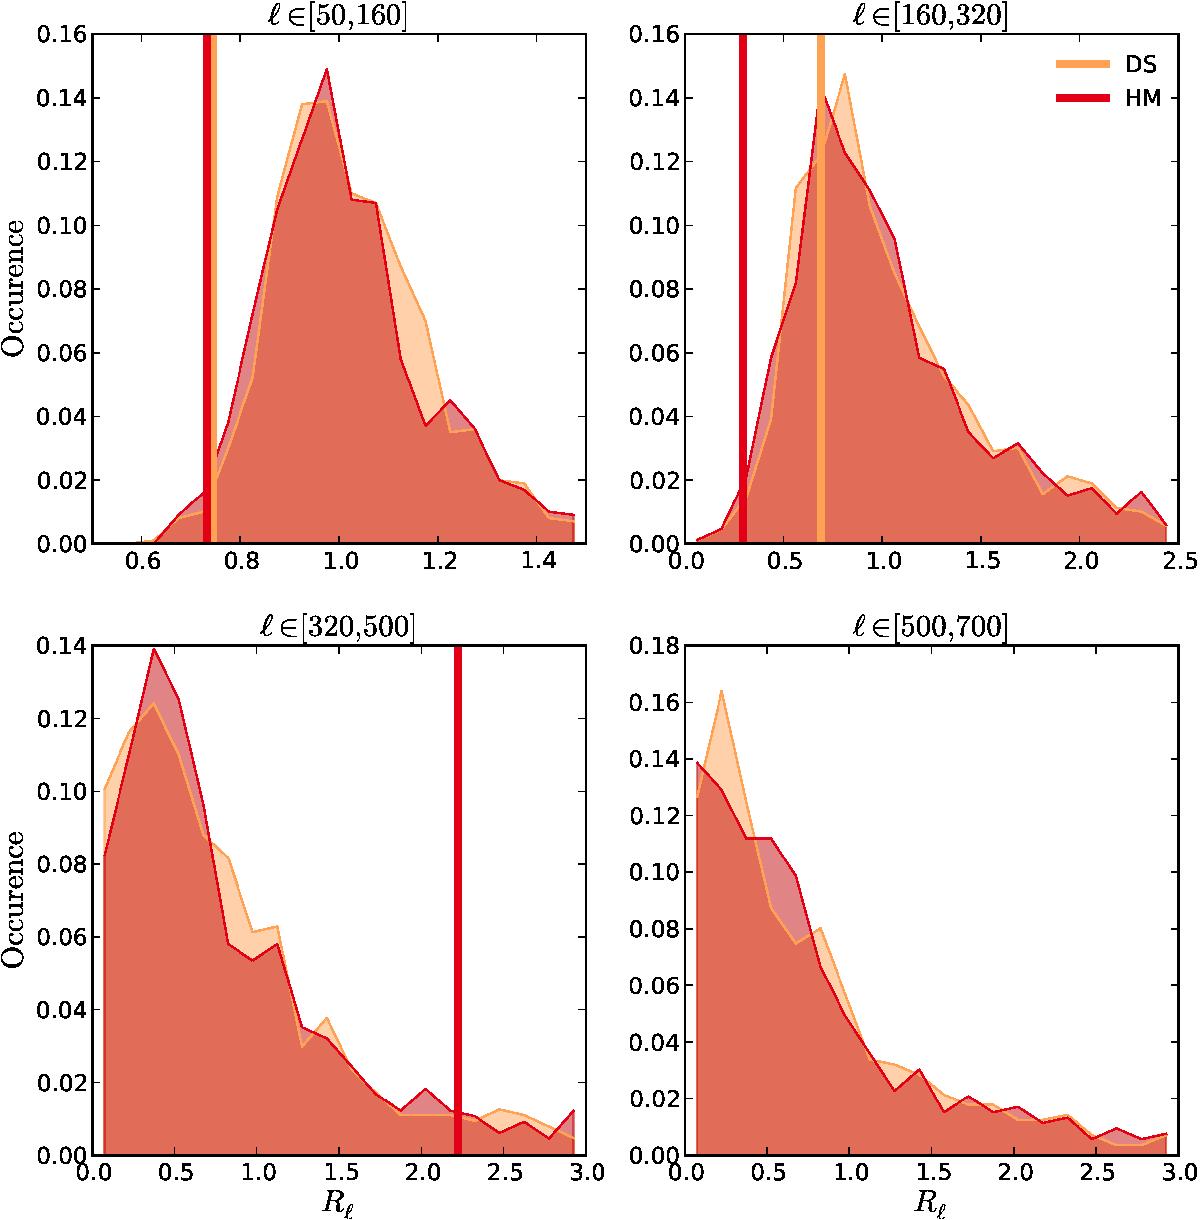
Distribution of the correlation ratios ![]() on the LR16 region from Planck simulations for detector-set (DS, red histograms) and half-mission (HM, orange histograms) data splits, for the four multipole bins we use in the analysis: top left, ℓ ∈ [50,160]; top right, ℓ ∈ [160,320]; bottom left, ℓ ∈ [320,500]; and bottom right, ℓ ∈ [500,700]. The values derived from the data are shown as vertical lines of the corresponding colour. The PTEs corresponding to these data values with respect to the simulations are reported in Table 1.
on the LR16 region from Planck simulations for detector-set (DS, red histograms) and half-mission (HM, orange histograms) data splits, for the four multipole bins we use in the analysis: top left, ℓ ∈ [50,160]; top right, ℓ ∈ [160,320]; bottom left, ℓ ∈ [320,500]; and bottom right, ℓ ∈ [500,700]. The values derived from the data are shown as vertical lines of the corresponding colour. The PTEs corresponding to these data values with respect to the simulations are reported in Table 1.
Current usage metrics show cumulative count of Article Views (full-text article views including HTML views, PDF and ePub downloads, according to the available data) and Abstracts Views on Vision4Press platform.
Data correspond to usage on the plateform after 2015. The current usage metrics is available 48-96 hours after online publication and is updated daily on week days.
Initial download of the metrics may take a while.