Fig. 5
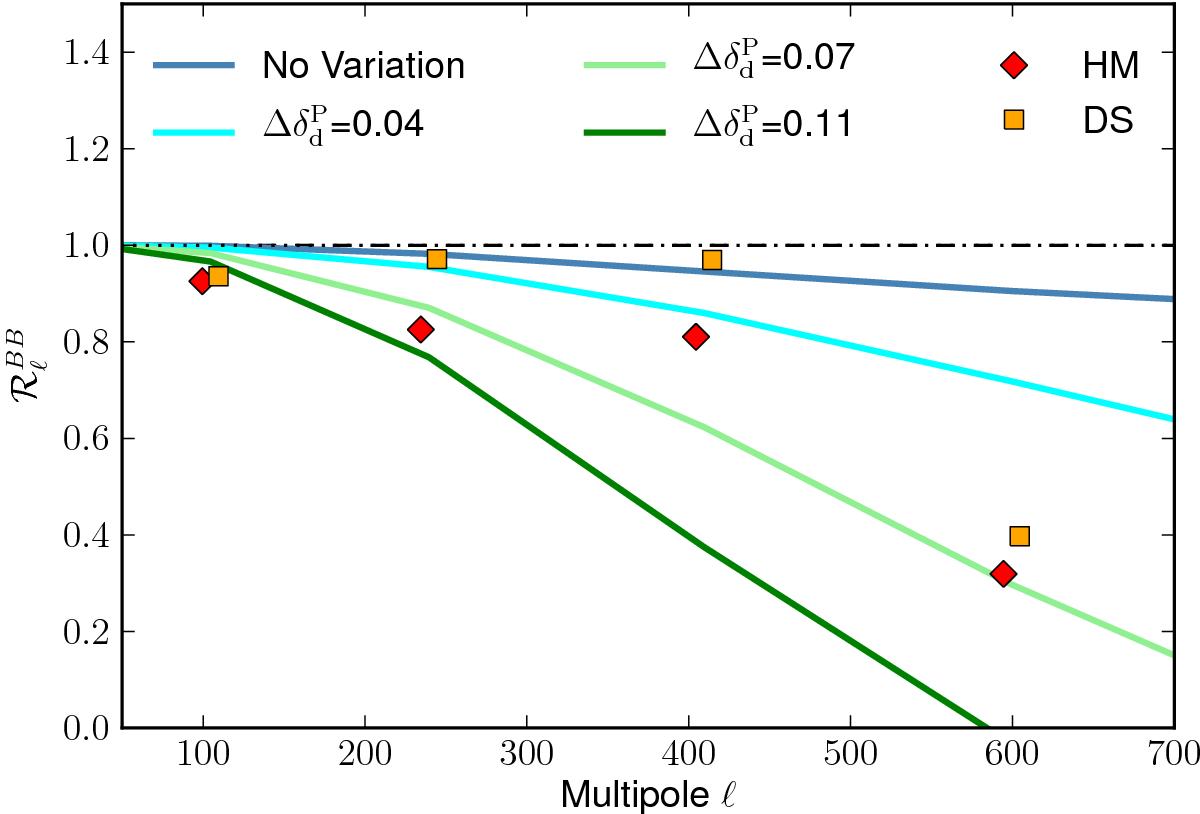
Correlation ratio modelled with Gaussian spatial variations of the polarized dust spectral index, in LR42 as in Fig. 2. The HM and DS Planck measurements are shown as diamonds and squares, respectively. The model is plotted for four values of ![]() , which is defined as the standard deviation of the Gaussian realization of the spectral index after smoothing at 1°. The first model, with
, which is defined as the standard deviation of the Gaussian realization of the spectral index after smoothing at 1°. The first model, with ![]() , is described in Sect. 3.2.
, is described in Sect. 3.2.
Current usage metrics show cumulative count of Article Views (full-text article views including HTML views, PDF and ePub downloads, according to the available data) and Abstracts Views on Vision4Press platform.
Data correspond to usage on the plateform after 2015. The current usage metrics is available 48-96 hours after online publication and is updated daily on week days.
Initial download of the metrics may take a while.