Fig. 2
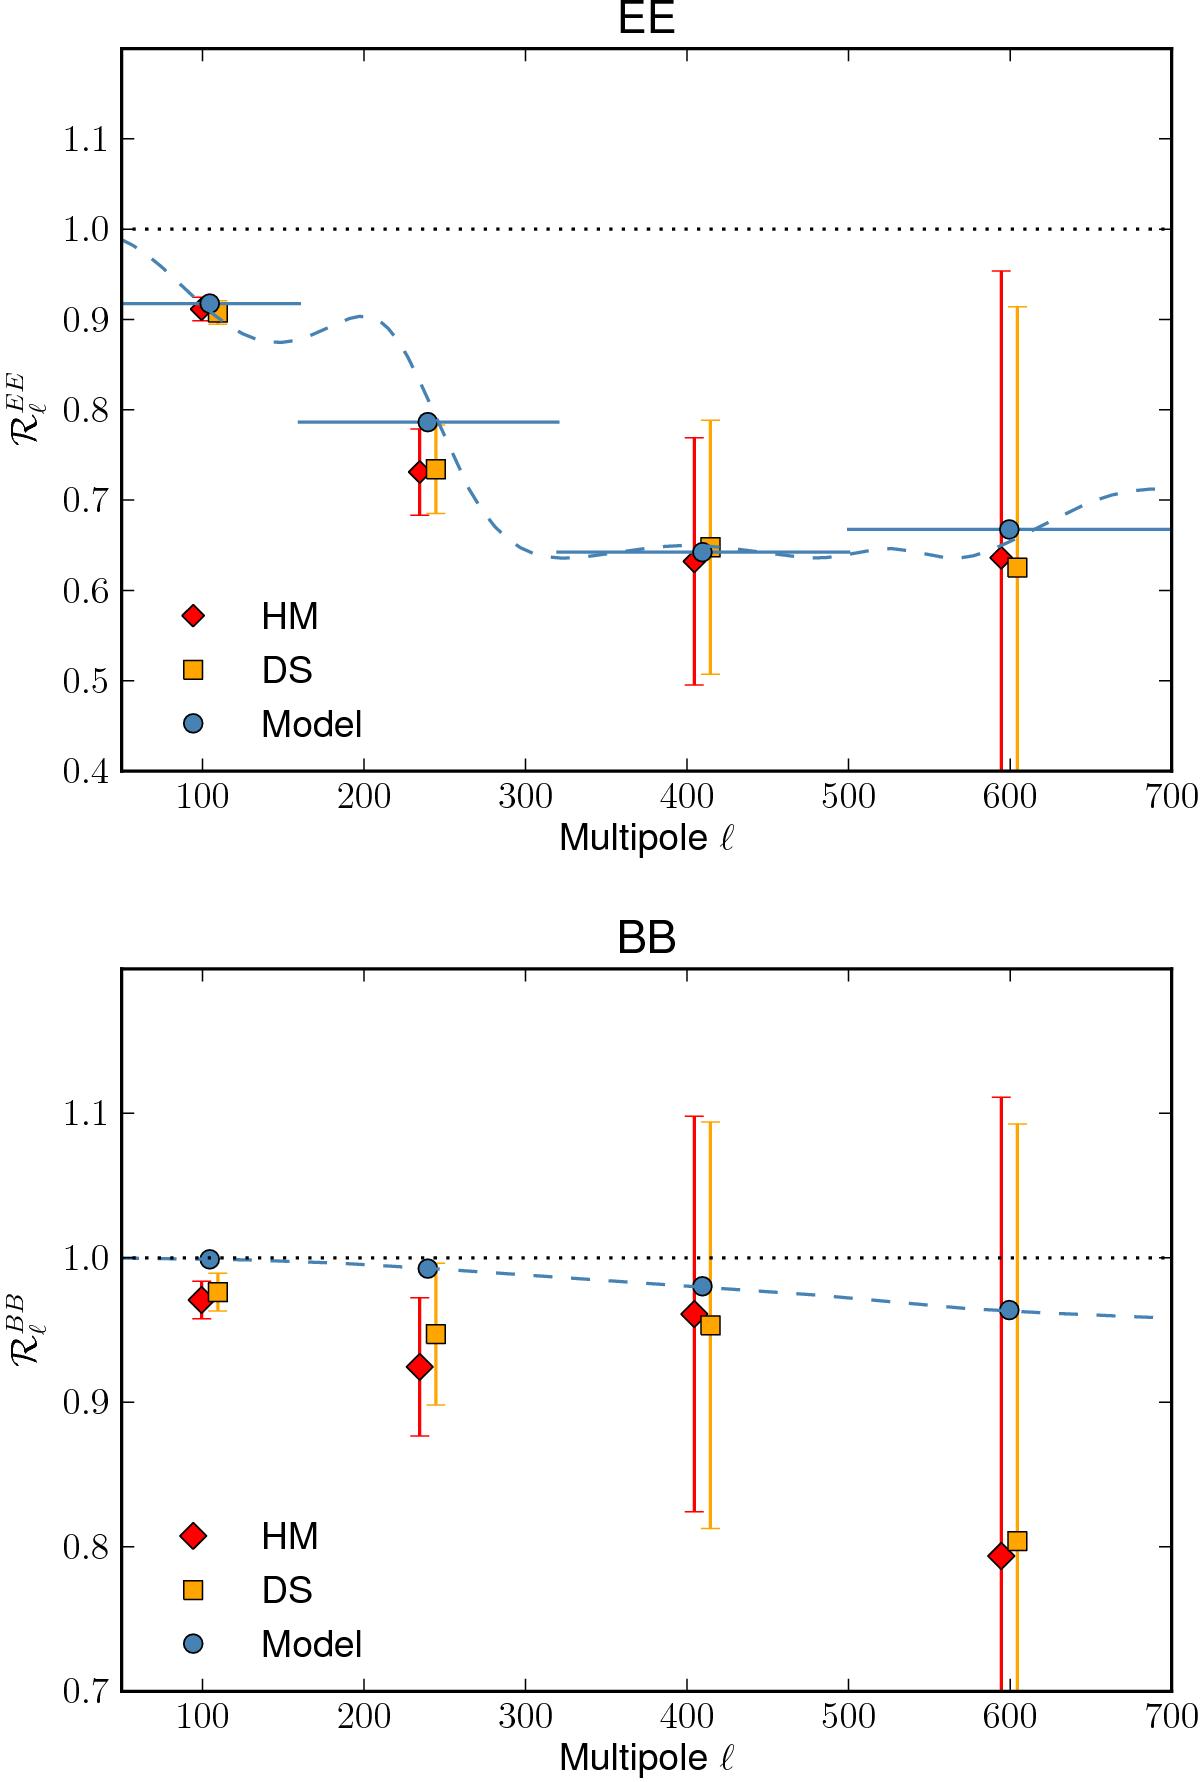
Dust polarization correlation ratios ![]() (top panel) and
(top panel) and ![]() (bottom panel) between 217 and 353 GHz, computed on the LR63 region. The correlation ratios determined from the detector-set data (DS) splits are shown as yellow squares and the ratios computed from the half-mission (HM) splits as red diamonds. The correlation ratio expectations for the model described in Eq. (5) are shown as blue dashed lines (blue circles when binned as the data). Horizontal blue segments in the top panel represent the range of the ℓ bins. The uncertainties have been estimated as the median absolute deviation over a set of 1000 simulations (see Sect. 2.3) of CMB, dust, and Gaussian noise.
(bottom panel) between 217 and 353 GHz, computed on the LR63 region. The correlation ratios determined from the detector-set data (DS) splits are shown as yellow squares and the ratios computed from the half-mission (HM) splits as red diamonds. The correlation ratio expectations for the model described in Eq. (5) are shown as blue dashed lines (blue circles when binned as the data). Horizontal blue segments in the top panel represent the range of the ℓ bins. The uncertainties have been estimated as the median absolute deviation over a set of 1000 simulations (see Sect. 2.3) of CMB, dust, and Gaussian noise.
Current usage metrics show cumulative count of Article Views (full-text article views including HTML views, PDF and ePub downloads, according to the available data) and Abstracts Views on Vision4Press platform.
Data correspond to usage on the plateform after 2015. The current usage metrics is available 48-96 hours after online publication and is updated daily on week days.
Initial download of the metrics may take a while.