Fig. 9
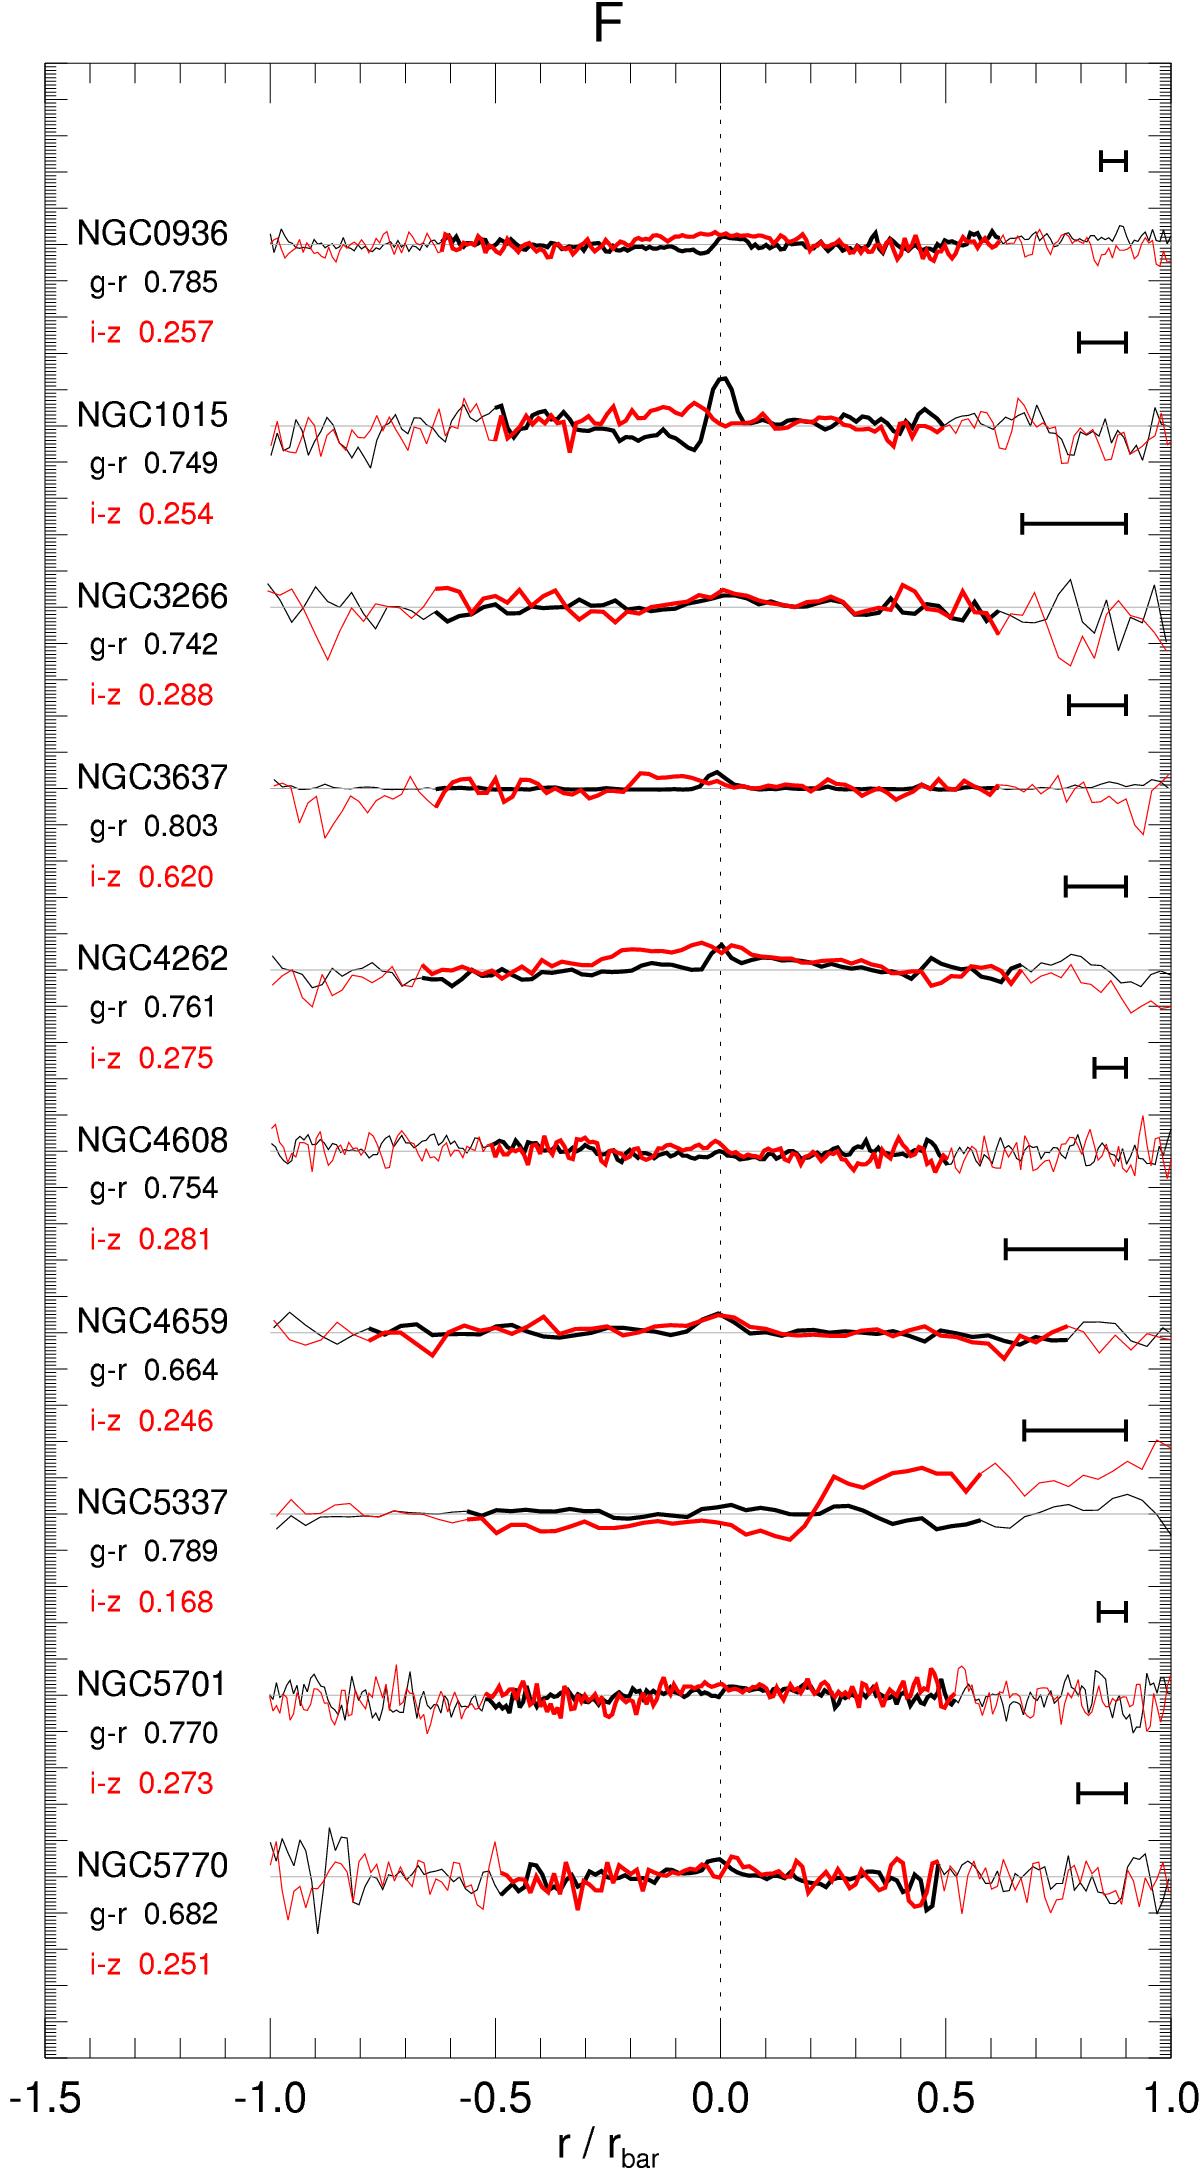
Bar major axis color profiles in (g−r) (black) and (i−z) (red) for the barlens galaxies in the F group. The radial coordinate is normalized to the radius of the bar (rbar), and the thick lines indicate the region inside the radius of the barlens (rbl). The horizontal lines indicate the median color along the bar, and the individual profiles are shifted by 0.5 mags. The dashed vertical line indicates the galaxy center. The labels in the left give the median (g−r) and (i−z) colors, and the bar on the right represents the FWHM of the g-band image for each galaxy. Similar plots for the RP, RP+nr, nb, B and D groups are shown in Appendix B.
Current usage metrics show cumulative count of Article Views (full-text article views including HTML views, PDF and ePub downloads, according to the available data) and Abstracts Views on Vision4Press platform.
Data correspond to usage on the plateform after 2015. The current usage metrics is available 48-96 hours after online publication and is updated daily on week days.
Initial download of the metrics may take a while.