Fig. 8
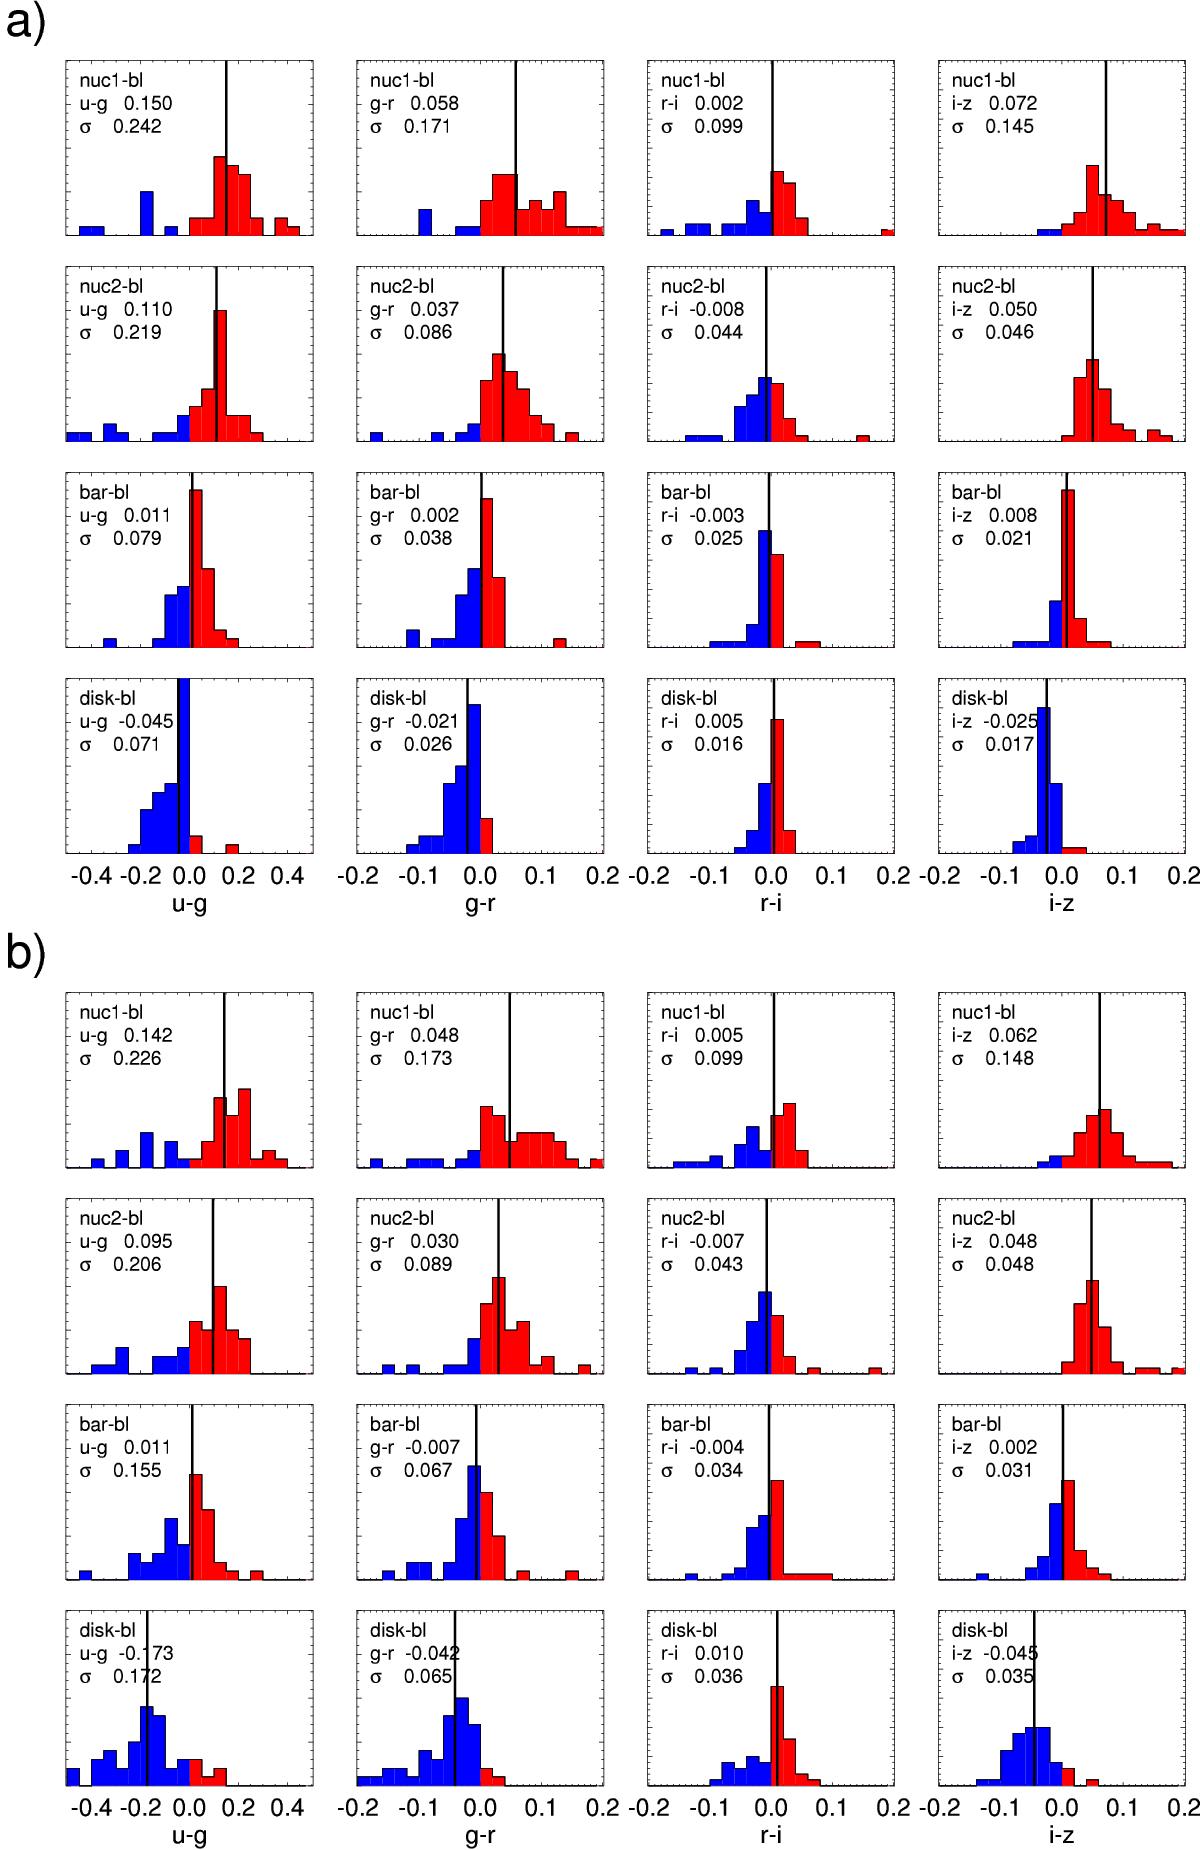
Color differences between the structure components calculated separately for each galaxy. Shown are the histograms of the deviations from barlens color (blc), for the color subsample. The deviations are shown in four color indices. The red and blue colors indicate whether the deviations are toward redder or bluer color, when compared to the color of the barlens. The numbers are the median values of the deviations, indicated also by the vertical lines, and the standard deviations (σ). Panel a) uses the measurements from approach 1 and panel b) those from approach 2 (see Sect. 4.2). The estimated photometric accuracy of the colors of individual galaxies is 0.03 mag.
Current usage metrics show cumulative count of Article Views (full-text article views including HTML views, PDF and ePub downloads, according to the available data) and Abstracts Views on Vision4Press platform.
Data correspond to usage on the plateform after 2015. The current usage metrics is available 48-96 hours after online publication and is updated daily on week days.
Initial download of the metrics may take a while.