Fig. 5
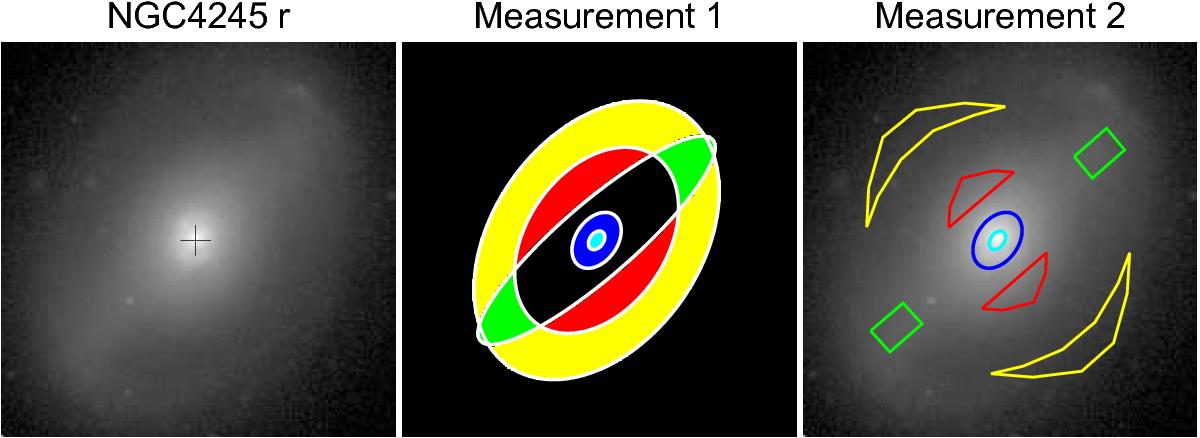
Illustration of the two methods used for defining the regions for the measurements of the component colors. In the left panel the r-band image of NGC 4245 is shown. In the middle panel we show the automatically defined regions for the central region (“nuc1” and “nuc2”; light and dark blue, respectively), for the barlens (“blc”; red), the bar (green), and the disk (yellow), see the text for details. In the right panel the manually selected regions for the barlens, the bar and the disk are shown (central regions are the same as in the middle panel). All images are in the same scale.
Current usage metrics show cumulative count of Article Views (full-text article views including HTML views, PDF and ePub downloads, according to the available data) and Abstracts Views on Vision4Press platform.
Data correspond to usage on the plateform after 2015. The current usage metrics is available 48-96 hours after online publication and is updated daily on week days.
Initial download of the metrics may take a while.