Fig. 3
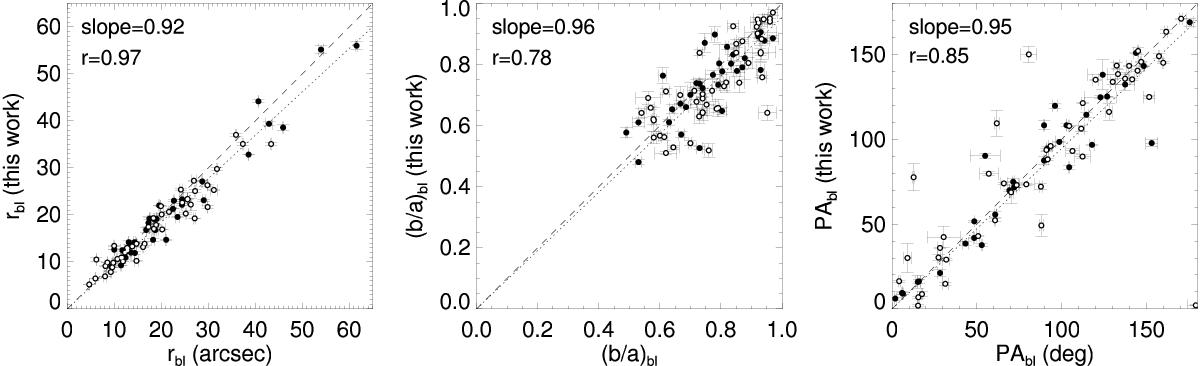
Sizes (rbl), axial ratios ((b/a)bl) and position angles (PAbl) of barlenses obtained in this study are compared with those previosuly obtained by Herrera-Endoqui et al. (2015) or Laurikainen et al. (2011). Dotted lines indicate linear fits between the old and new measurements, whereas the dashed line stands for a unit slope. The labels indicate the slope and correlation coefficient of the linear fit. The galaxies that belong to the color subsample are indicated with an open symbol.
Current usage metrics show cumulative count of Article Views (full-text article views including HTML views, PDF and ePub downloads, according to the available data) and Abstracts Views on Vision4Press platform.
Data correspond to usage on the plateform after 2015. The current usage metrics is available 48-96 hours after online publication and is updated daily on week days.
Initial download of the metrics may take a while.