Fig. 10
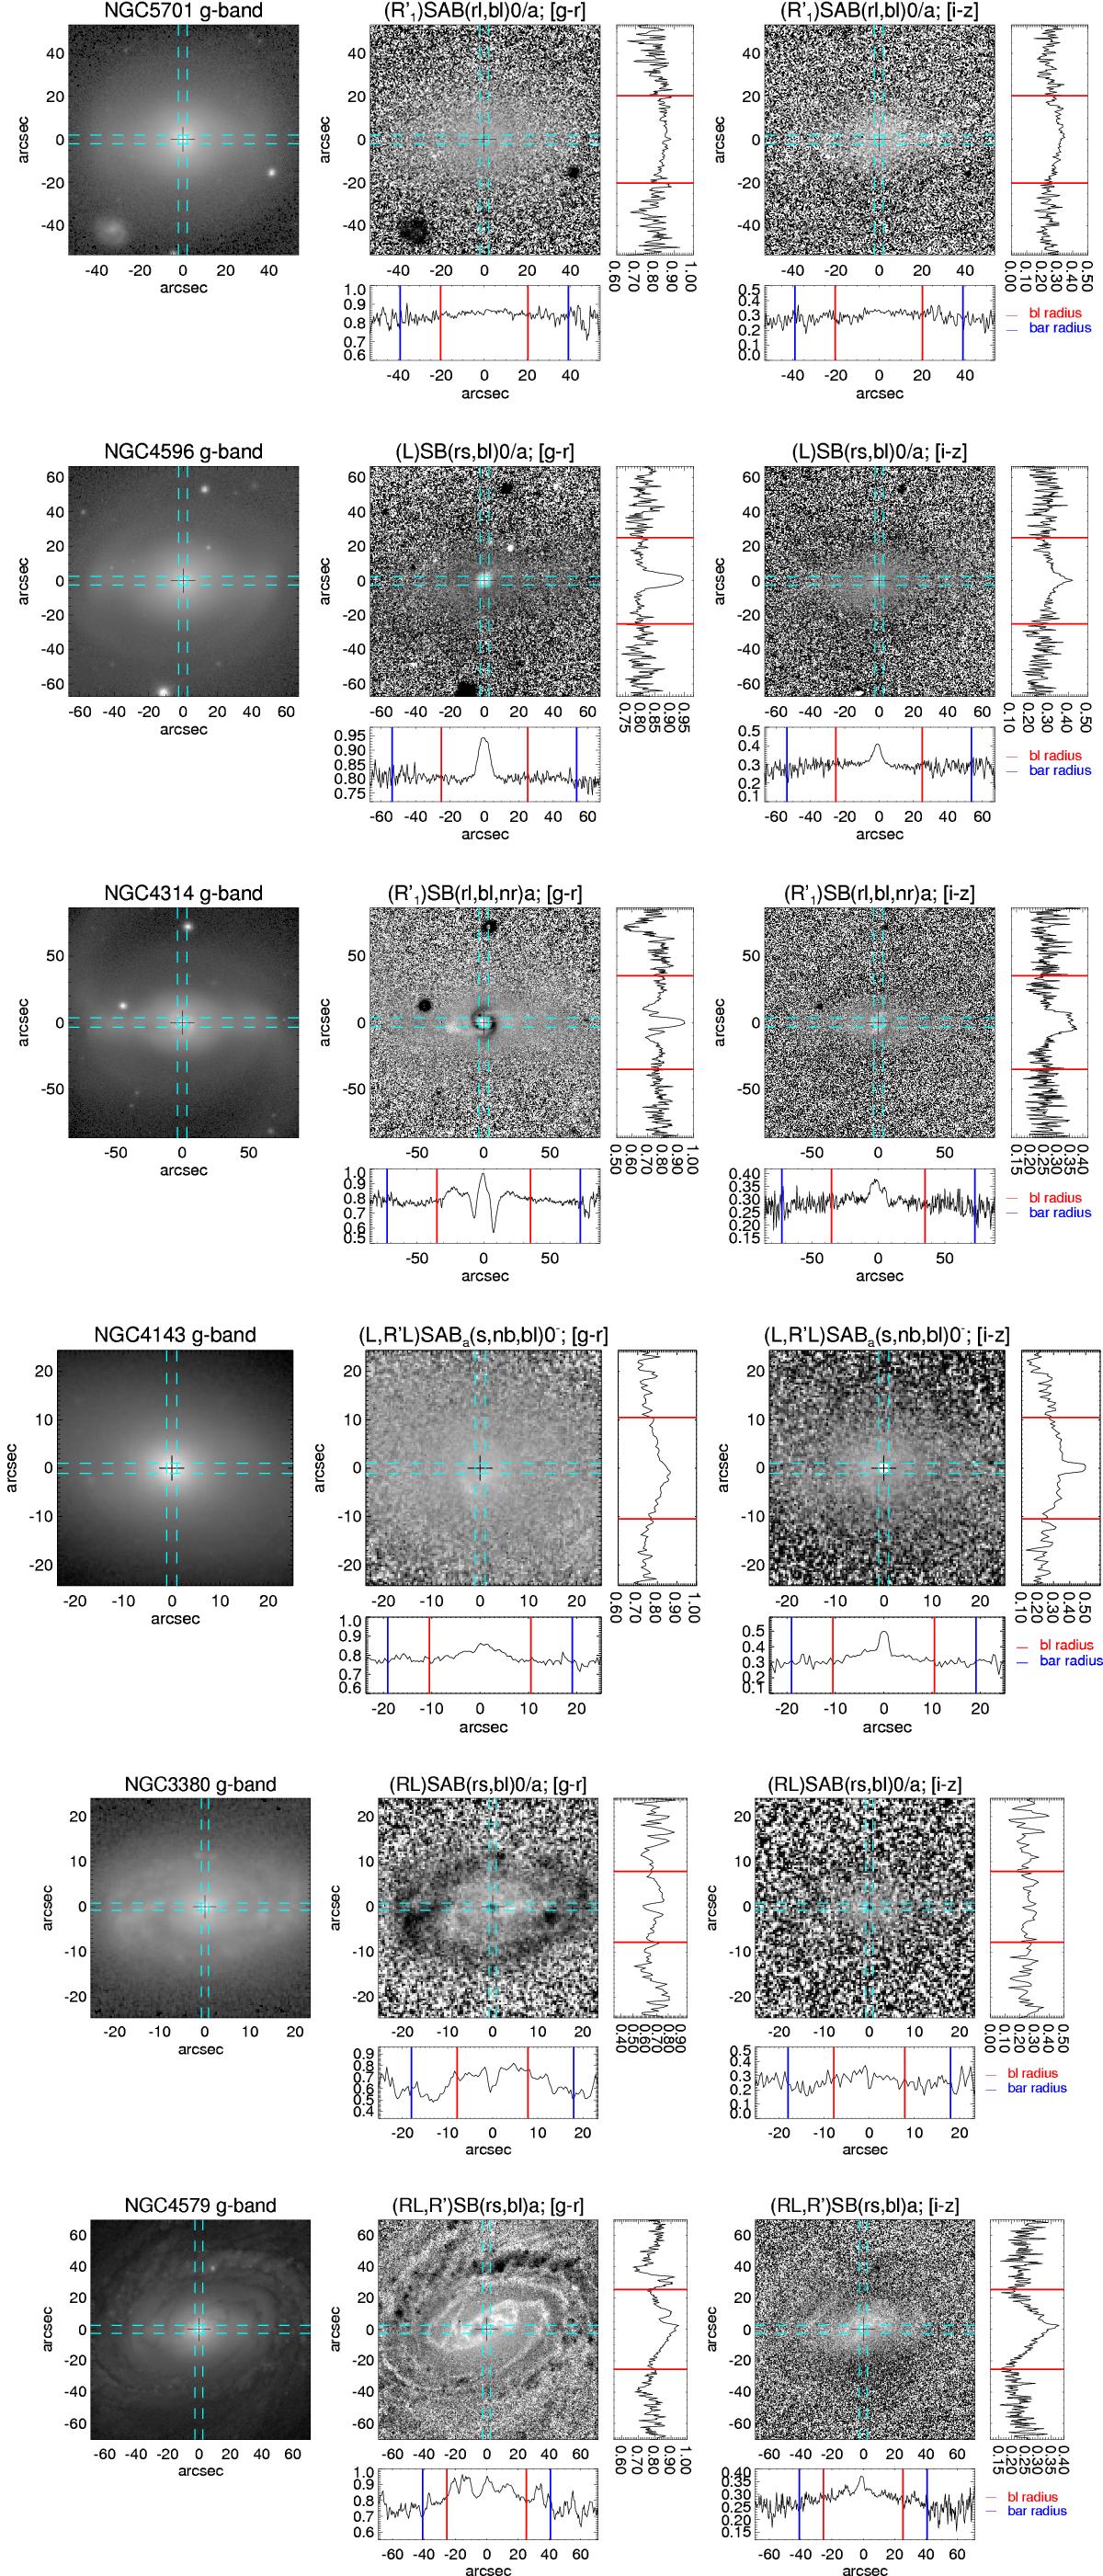
Examples of the different types of barlenses discussed in the text. For each galaxy shown are: g-band image (left), (g−r) color map (middle), and (i−z) color map (right). For the color maps shown are also the color profiles along the bar major and minor axes, measured within the regions marked with dashed lines. The vertical lines in the profiles indicate the bar (blue) and the barlens (red) radii. All the dimensions are in arcseconds, and the images are rotated so that the bar (measured from the 3.6 or 2.2 μm image) is horizontally oriented. Similar plots for the rest of galaxies in the color subsample are shown in Appendix A.
Current usage metrics show cumulative count of Article Views (full-text article views including HTML views, PDF and ePub downloads, according to the available data) and Abstracts Views on Vision4Press platform.
Data correspond to usage on the plateform after 2015. The current usage metrics is available 48-96 hours after online publication and is updated daily on week days.
Initial download of the metrics may take a while.