Fig. 1
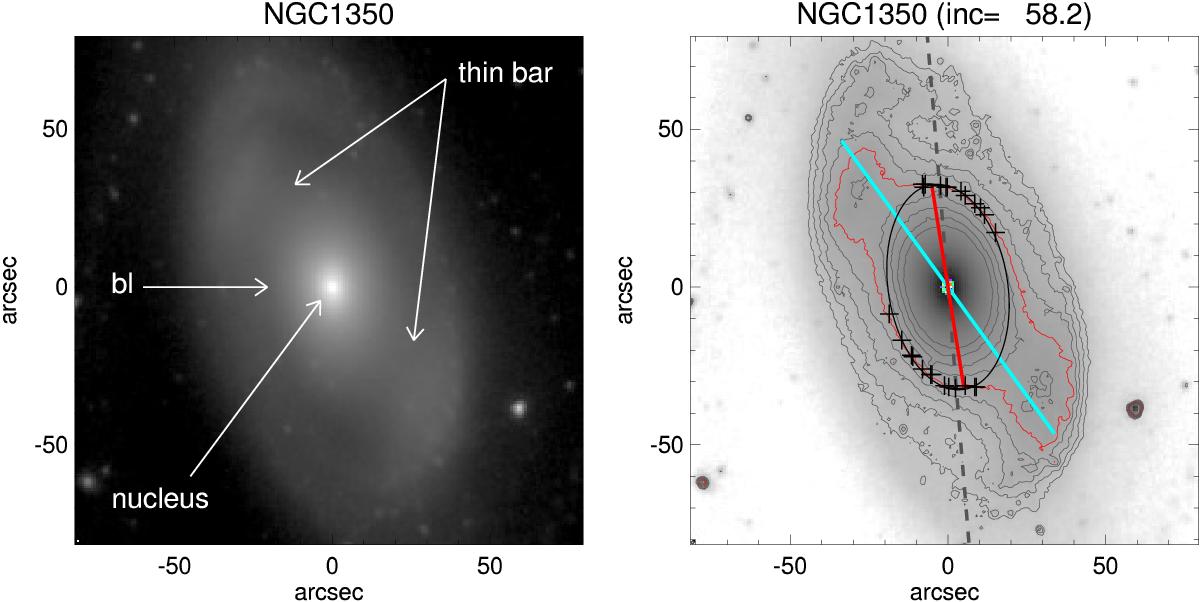
Example barlens galaxy, NGC 1350. Left panel: the bar region of the 3.6 μm image. Marked are the structure components measured in this study: “bl” refers to barlens, “thin bar” is the bar region outside the barlens, and “nucleus” refers to possible small bulge in the central regions. Right panel: the contours of the same image. Lines indicating the orientations of the bar (blue line), barlens (red line), and the disk line-of-nodes (dashed line) are over-plotted. Black crosses show the points selected to measure the size and orientation of the barlens by fitting an ellipse to these points.
Current usage metrics show cumulative count of Article Views (full-text article views including HTML views, PDF and ePub downloads, according to the available data) and Abstracts Views on Vision4Press platform.
Data correspond to usage on the plateform after 2015. The current usage metrics is available 48-96 hours after online publication and is updated daily on week days.
Initial download of the metrics may take a while.