Fig. 6
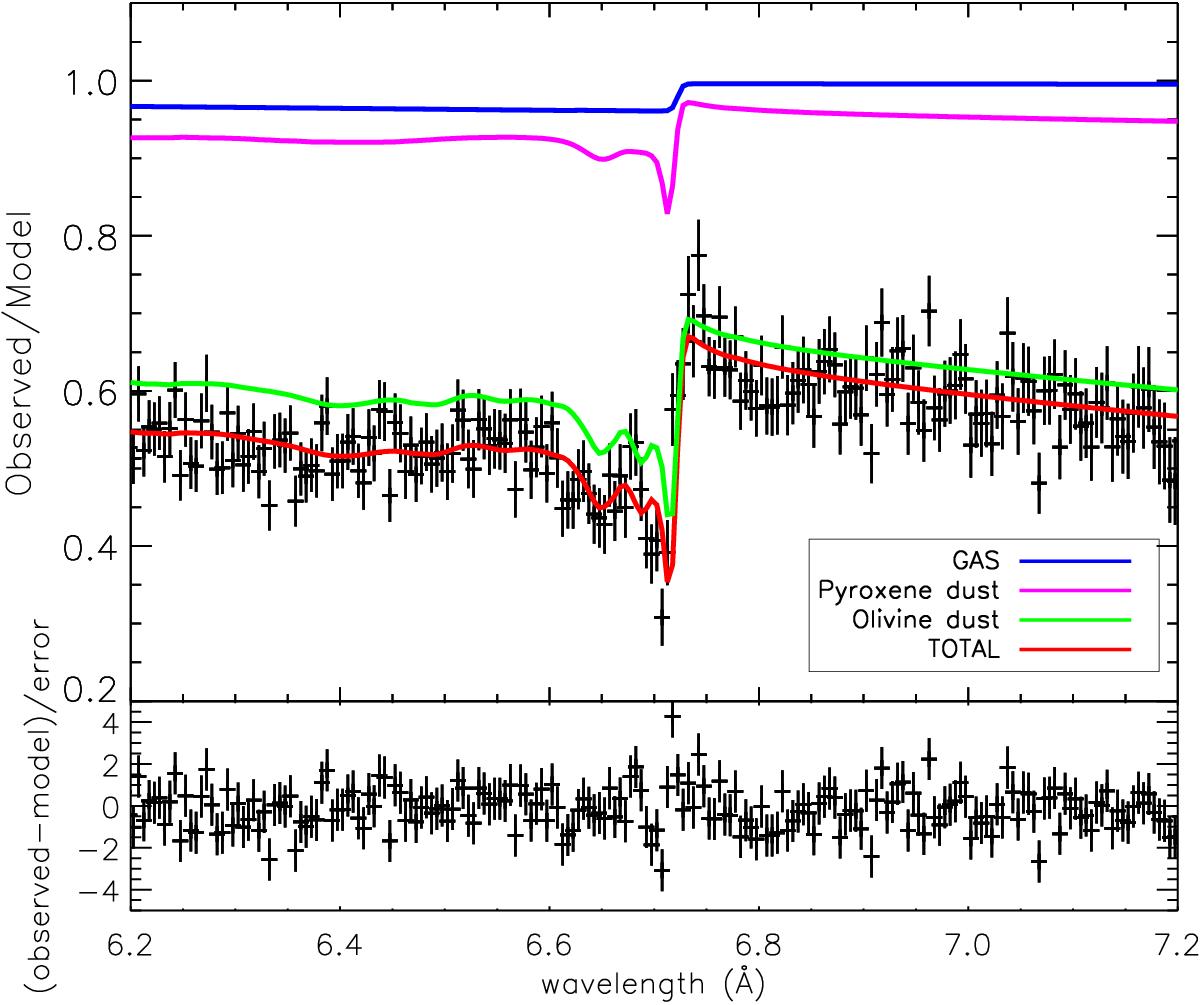
Fit to the spectrum of GX 5-1 is shown in red. The contribution of the continuum is divided out. The other lines show the contribution of the absorbing components to the transmission. The purple line shows the contribution of pyroxene (sample 5), the green line the contribution of olivine (sample 1), and the blue line the contribution of gas. The lower panel shows the model residuals of the fit in terms of the standard deviation, σ.
Current usage metrics show cumulative count of Article Views (full-text article views including HTML views, PDF and ePub downloads, according to the available data) and Abstracts Views on Vision4Press platform.
Data correspond to usage on the plateform after 2015. The current usage metrics is available 48-96 hours after online publication and is updated daily on week days.
Initial download of the metrics may take a while.