Fig. 5
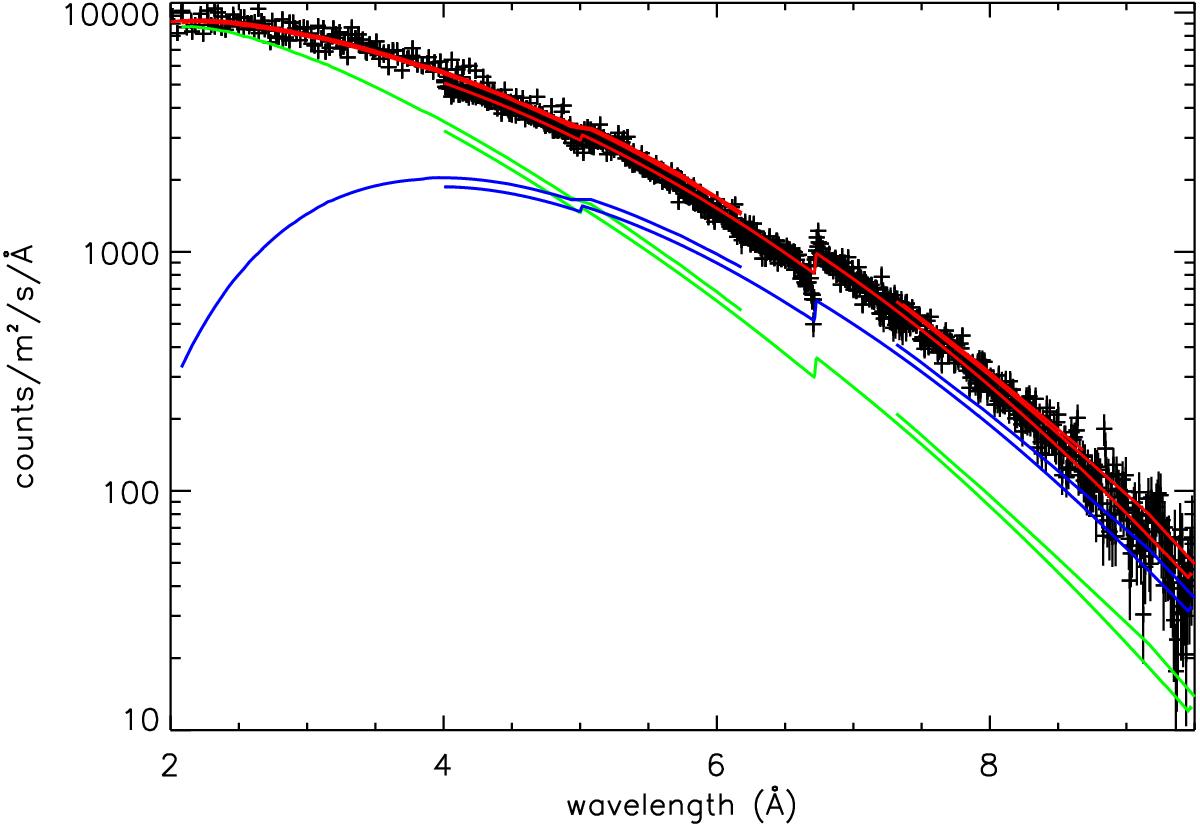
Continuum of GX 5-1. Data from the HEG short exposure, MEG short exposure, and HEG long exposure (OBSID 716) were used to fit the continuum. The resulting fit to each of the three data sets is shown by a red line. The model consists of two absorbed black bodies. The two black bodies in the model are represented in the figure by the green and blue lines. For clarity, only the black body models of the HEG grating (both long and short exposure) are shown and the MEG data has been omitted in the figure, therefore each black body model shows two curves.
Current usage metrics show cumulative count of Article Views (full-text article views including HTML views, PDF and ePub downloads, according to the available data) and Abstracts Views on Vision4Press platform.
Data correspond to usage on the plateform after 2015. The current usage metrics is available 48-96 hours after online publication and is updated daily on week days.
Initial download of the metrics may take a while.