Free Access
Fig. 8
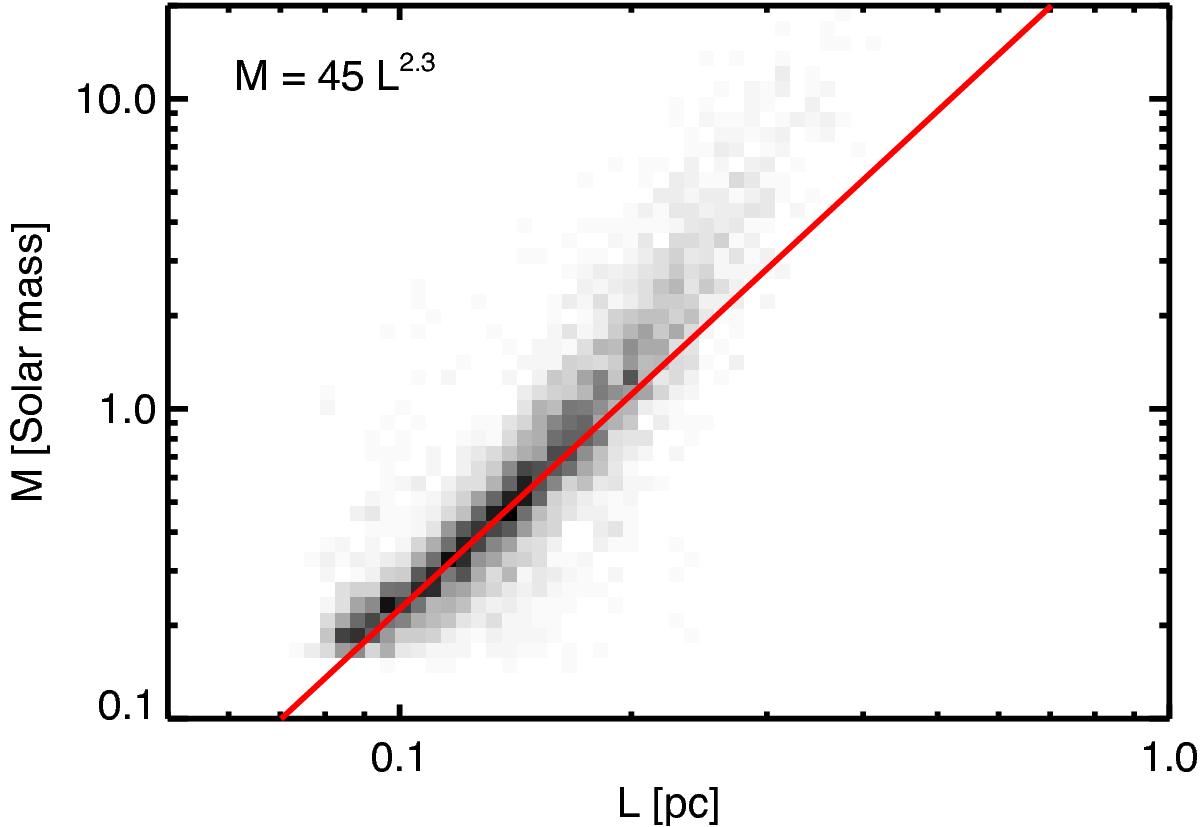
Two-dimensional histogram of M vs. L. The grayscale is proportional to the density of points. The red line is not a fit. It is indicative of the trend seen at low values of L and M.
Current usage metrics show cumulative count of Article Views (full-text article views including HTML views, PDF and ePub downloads, according to the available data) and Abstracts Views on Vision4Press platform.
Data correspond to usage on the plateform after 2015. The current usage metrics is available 48-96 hours after online publication and is updated daily on week days.
Initial download of the metrics may take a while.