Free Access
Fig. 4
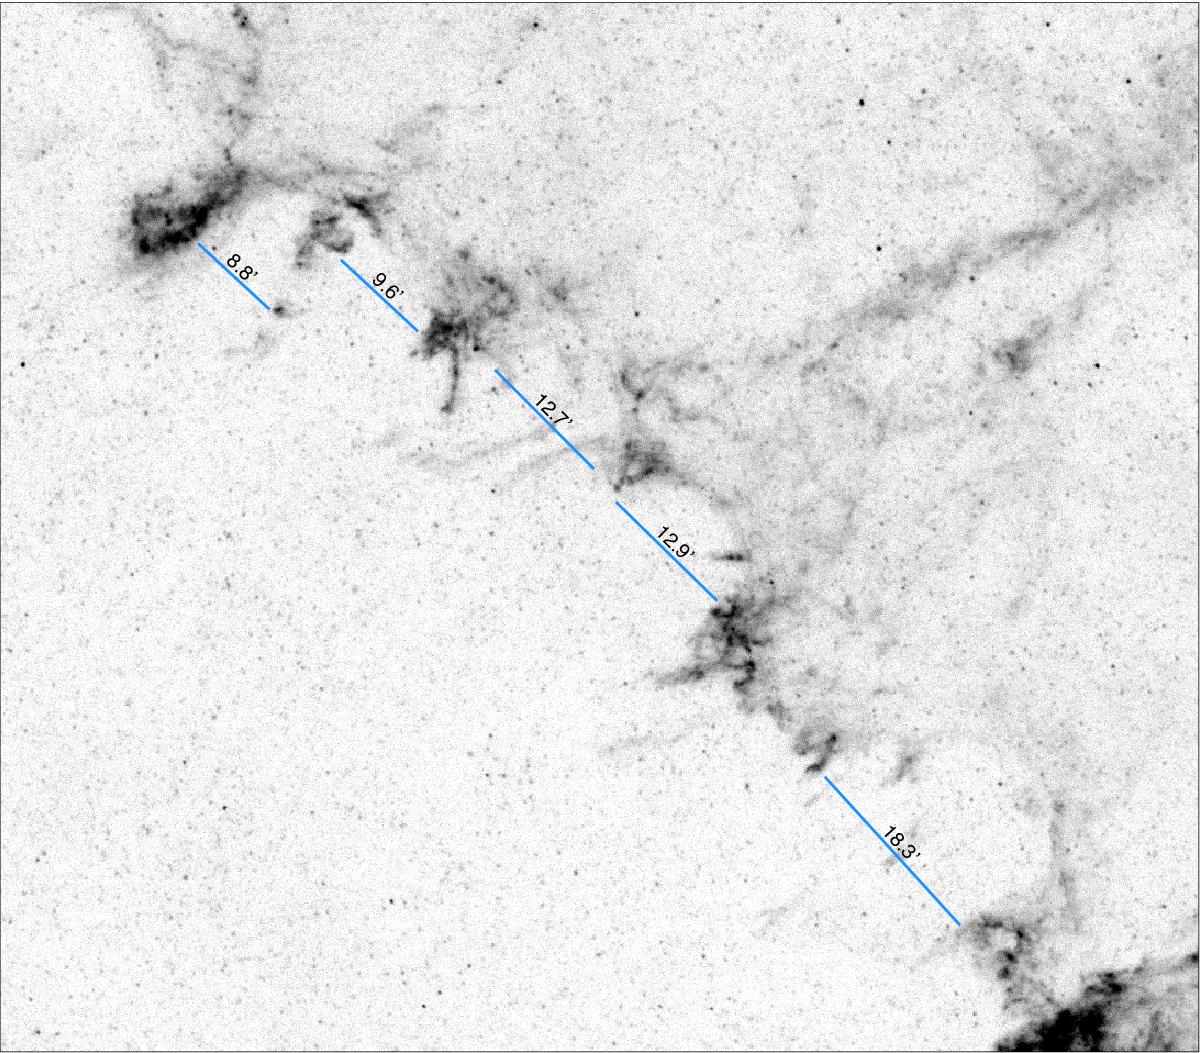
Rayleigh-Taylor instability structure as seen in the 250 μm SPIRE map. The blue lines give the apparent distance between fingers.
Current usage metrics show cumulative count of Article Views (full-text article views including HTML views, PDF and ePub downloads, according to the available data) and Abstracts Views on Vision4Press platform.
Data correspond to usage on the plateform after 2015. The current usage metrics is available 48-96 hours after online publication and is updated daily on week days.
Initial download of the metrics may take a while.