Fig. 6
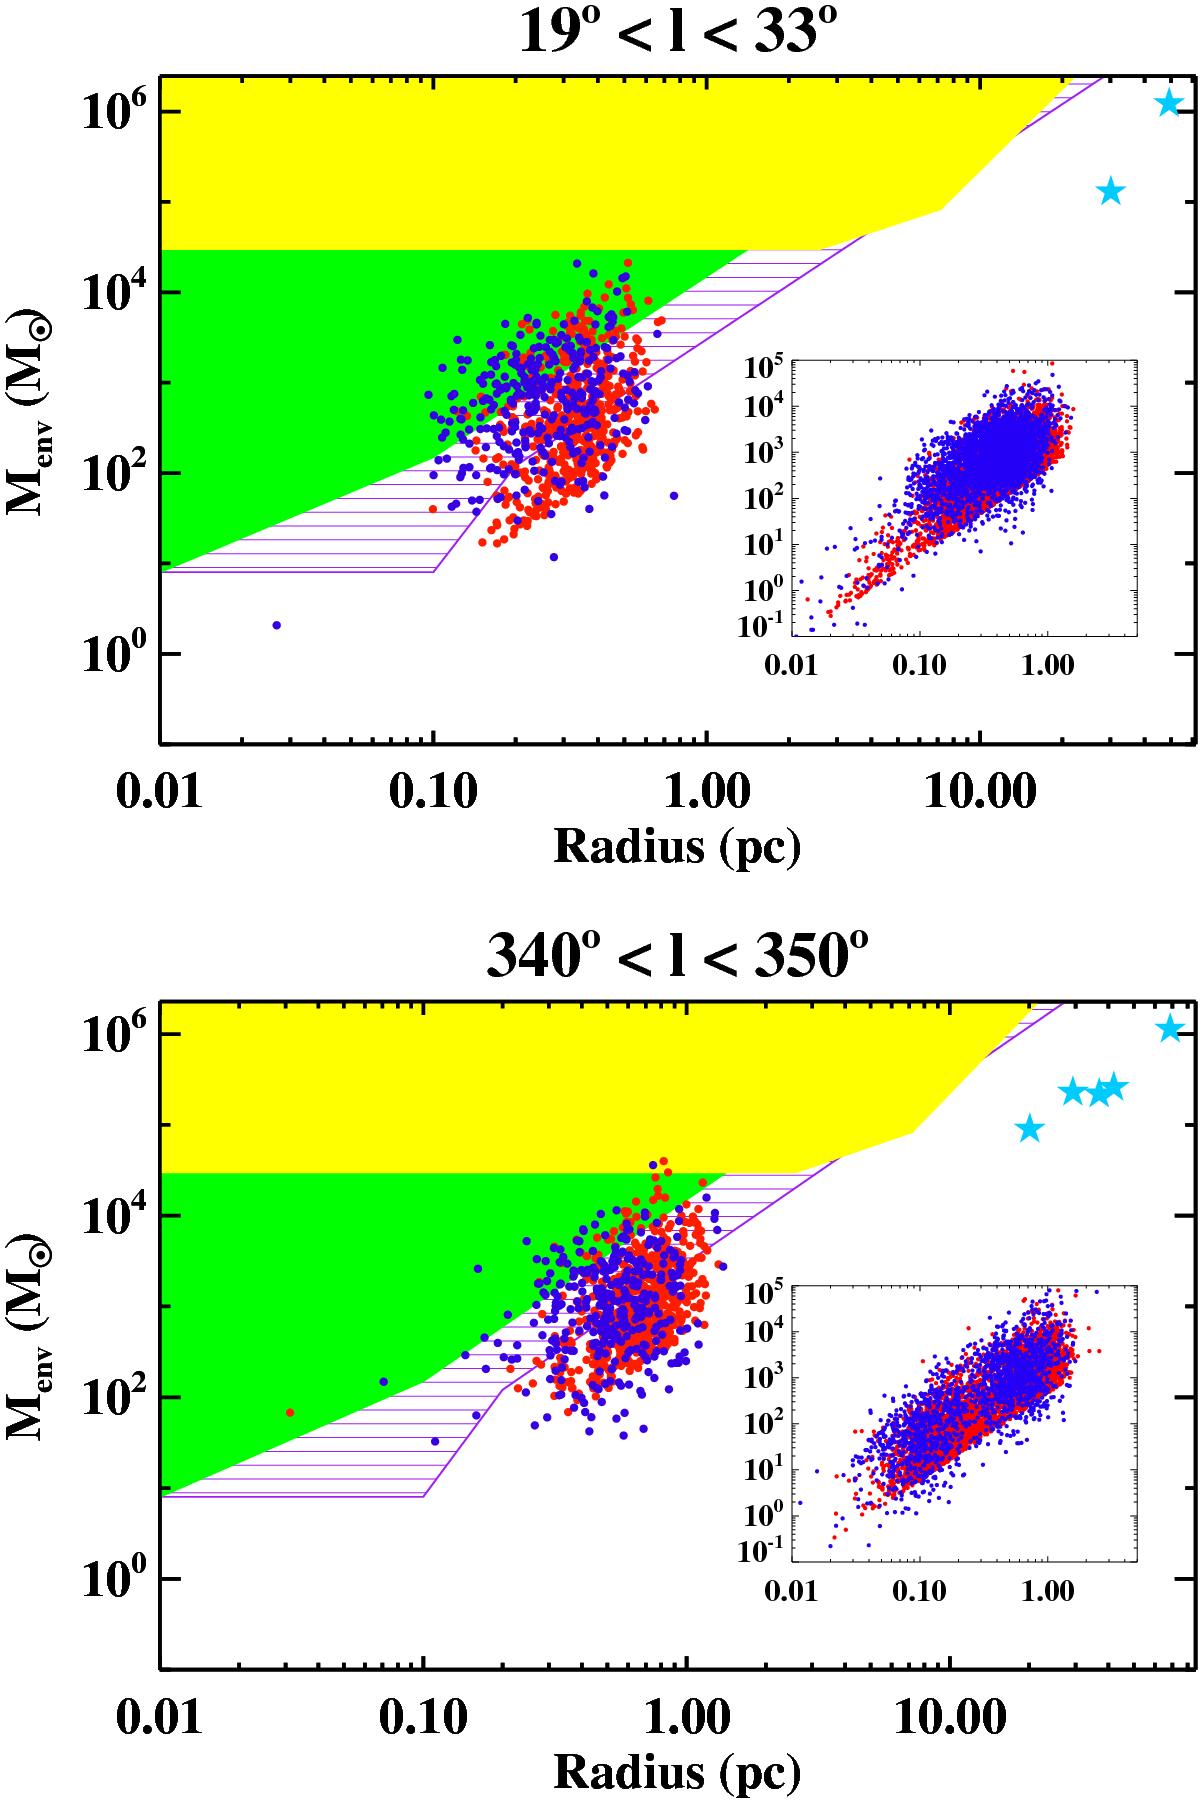
Radius vs. envelope mass of our protostellar (blue dots), prestellar (red dots) sources at the bar. In the small windows, the same trend for the rest of the sample is also shown. The green solid and the purple dashed areas are the loci with medium densities higher than 1 g/cm2 and 0.2 g/cm2, respectively, where massive star formation starts. The yellow shaded area indicates the region of young massive clusters progenitors. To have a broad picture of the loci occupied by objects of a different nature, we also show the GMC (light blue stars) located in the analyzed regions, as calculated and reported in Sect. 4 and Table 4.
Current usage metrics show cumulative count of Article Views (full-text article views including HTML views, PDF and ePub downloads, according to the available data) and Abstracts Views on Vision4Press platform.
Data correspond to usage on the plateform after 2015. The current usage metrics is available 48-96 hours after online publication and is updated daily on week days.
Initial download of the metrics may take a while.