Fig. 3
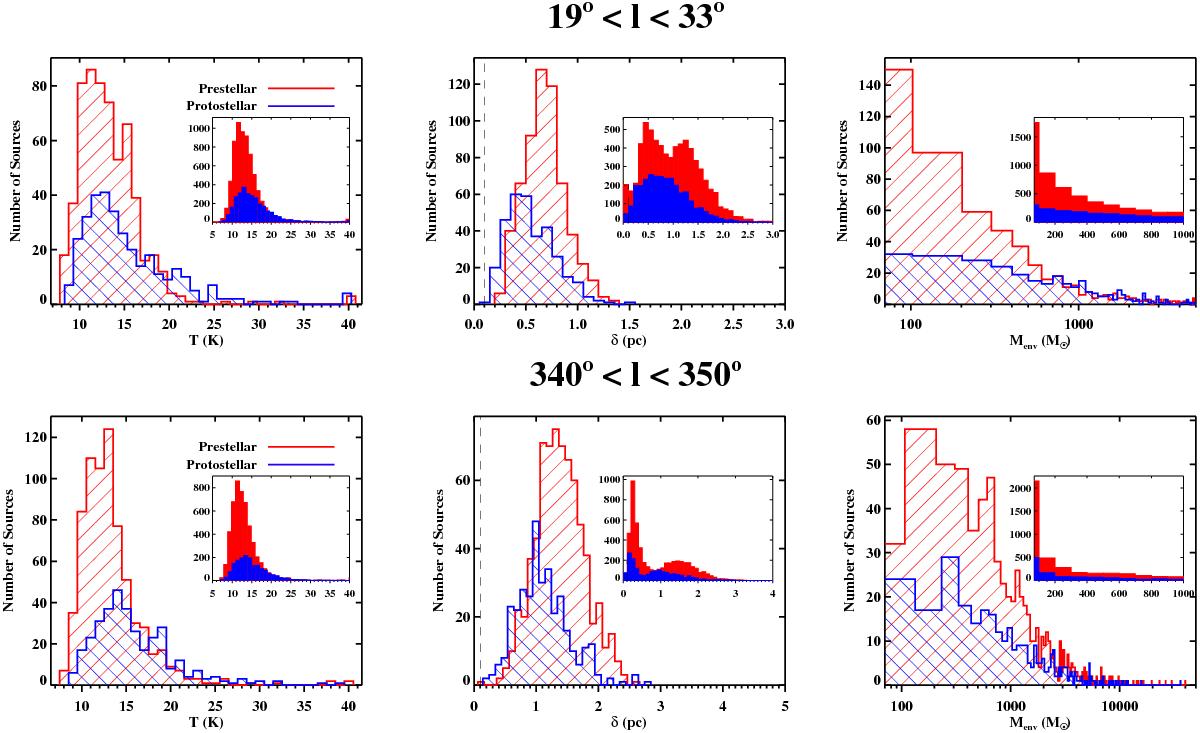
Physical properties of prestellar (red) and protostellar (blue) sources at the tips of the bar in the first quadrant (top) and fourth quadrant (bottom). The data in the small windows show the same distributions in the entire fields of view, therefore not only at the bar but also in background and foreground regions. The dashed vertical line at the very left hand side in the size distribution marks the separation between core and clumps according to Bergin & Tafalla (2007).
Current usage metrics show cumulative count of Article Views (full-text article views including HTML views, PDF and ePub downloads, according to the available data) and Abstracts Views on Vision4Press platform.
Data correspond to usage on the plateform after 2015. The current usage metrics is available 48-96 hours after online publication and is updated daily on week days.
Initial download of the metrics may take a while.