Fig. 2
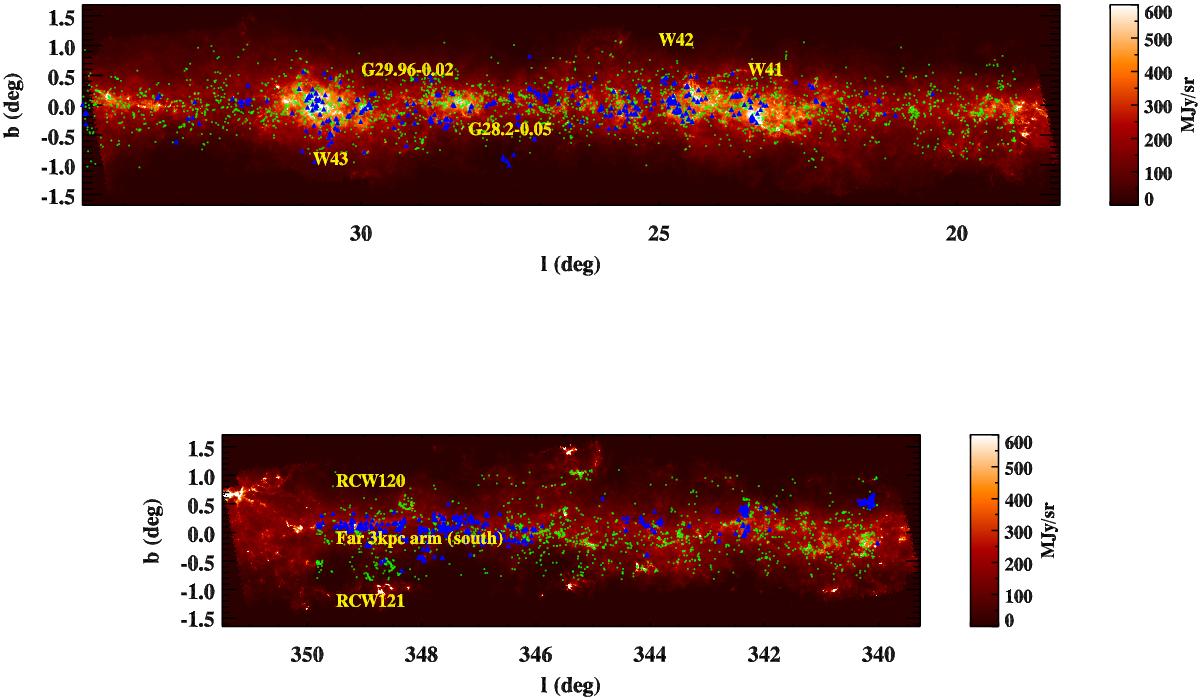
Images of the two observed areas in the first (top) and fourth (bottom) Galactic quadrant with Herschel/SPIRE at 500 μm. Green dots indicate protostellar objects in the entire field while blue triangles show protostellar clumps at the bar, i.e. at a distance 5 < d < 7 kpc in the first quadrant and 10 < d < 12 kpc in the fourth quadrant (see Sect. 4 for more details). Known star forming regions from Blum et al. (1999), Leahy & Tian (2008), Zavagno et al. (2010), Urquhart et al. (2011), Sewilo et al. (2011) are labeled in yellow.
Current usage metrics show cumulative count of Article Views (full-text article views including HTML views, PDF and ePub downloads, according to the available data) and Abstracts Views on Vision4Press platform.
Data correspond to usage on the plateform after 2015. The current usage metrics is available 48-96 hours after online publication and is updated daily on week days.
Initial download of the metrics may take a while.