Fig. 1
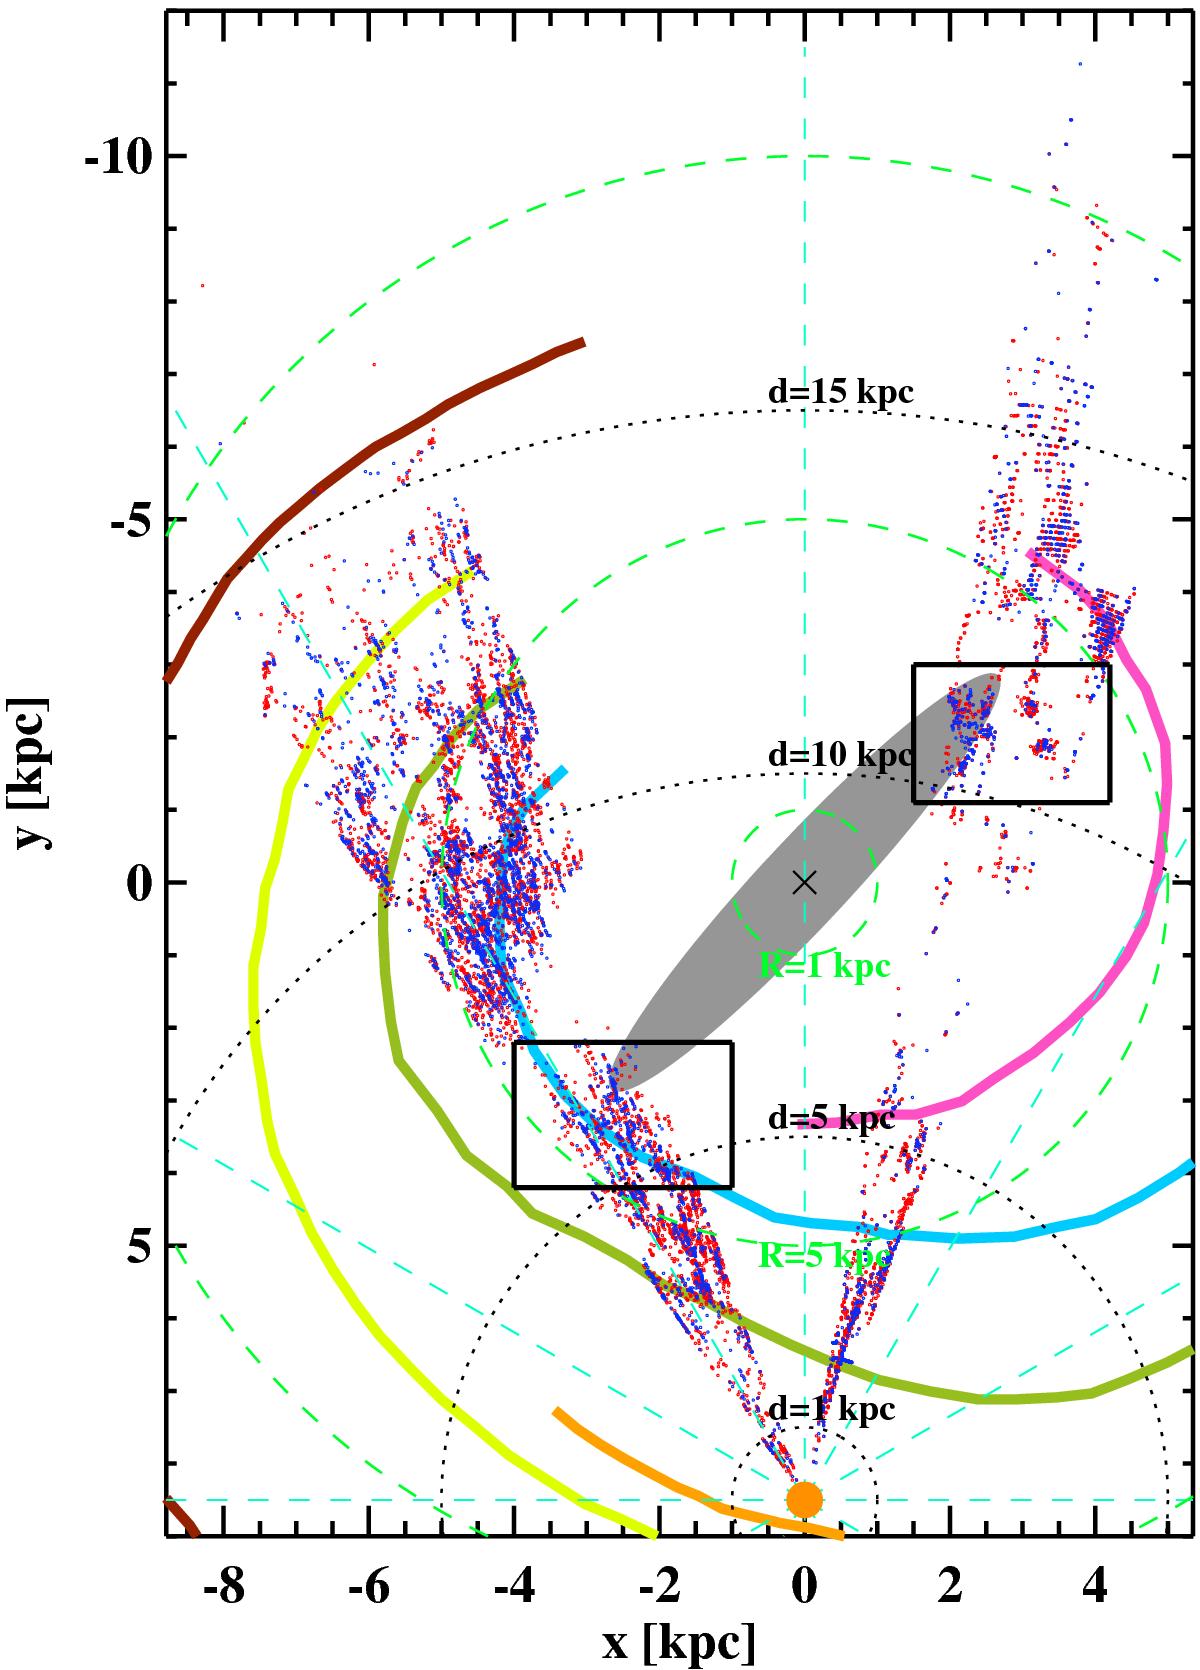
Galactic distribution of the identified clumps in the first and fourth quadrant. The colored thick lines trace the empirical Galactic spiral arms as reported by Drimmel & Spergel (2001). Blue dots indicate sources with a 70 μm emission (candidate protostellar sources), while red dots indicate prestellar objects. The black dotted circles indicate the heliocentric distance, while the green dashed circles indicate the galactocentric radius. The long bar as from Amores et al. (2013) is shown in gray, and the black rectangles indicate the sources considered at the edges of the bar in the present paper. The Sun is at the bottom of the image (orange circle) and the GC is represented by the black cross at the position (0, 0). The colored curves trace the empirical position of main spiral arms mapped by HII regions and dust (Russeil 2003; Vallée 2005).
Current usage metrics show cumulative count of Article Views (full-text article views including HTML views, PDF and ePub downloads, according to the available data) and Abstracts Views on Vision4Press platform.
Data correspond to usage on the plateform after 2015. The current usage metrics is available 48-96 hours after online publication and is updated daily on week days.
Initial download of the metrics may take a while.