Fig. 1
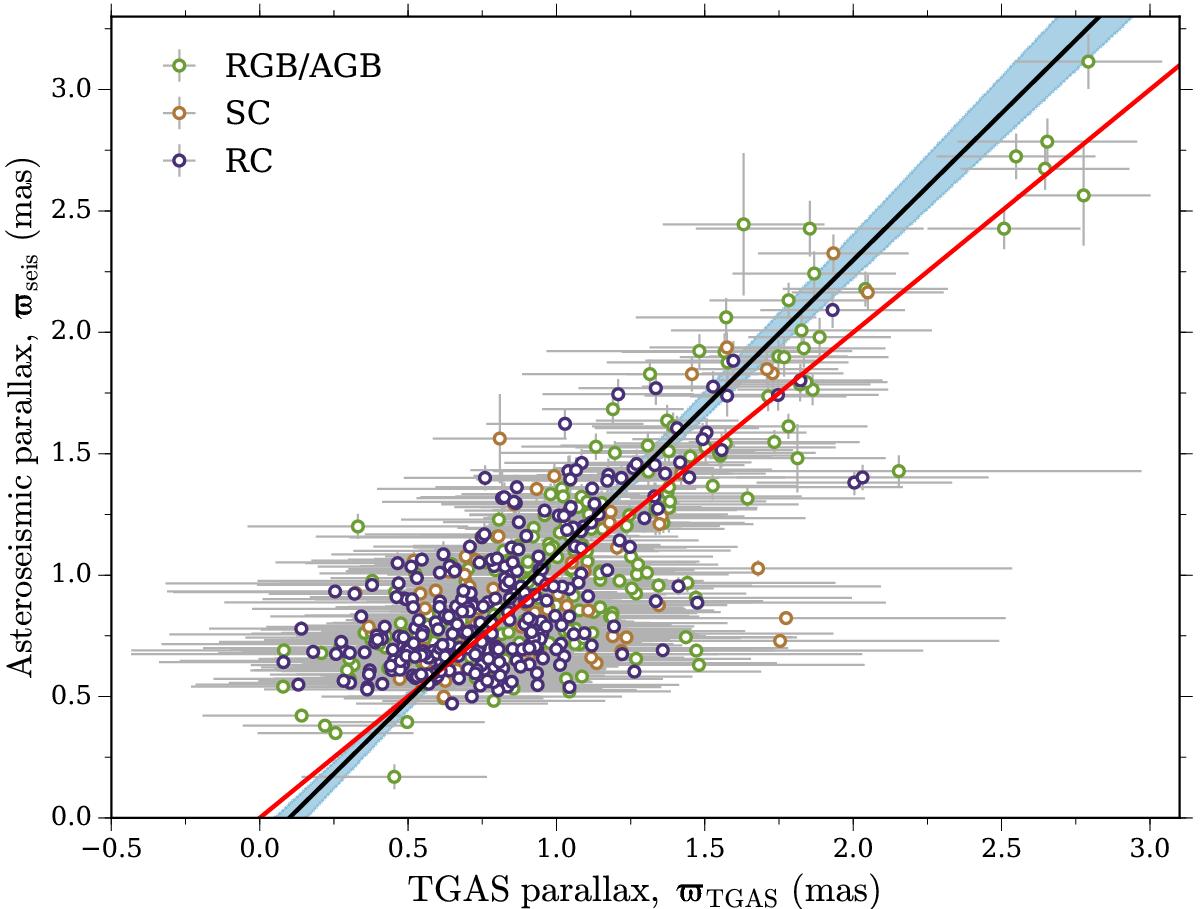
Comparison between asteroseismic and TGAS parallaxes. The markers indicate the evolutionary state of the star, including the red giant branch (RGB or AGB), the red clump (RC), and the secondary clump (SC). The red line shows the 1:1 relation. The black line shows the linear relation obtained from an orthogonal distance regression (ODR), which includes uncertainties on both parallax estimates. The best-fitting relation is ϖseis = (1.21 ± 0.07) × ϖTGAS−(0.12 ± 0.08). The shaded blue region shows the 1-σ confidence interval around the best-fitting relation.
Current usage metrics show cumulative count of Article Views (full-text article views including HTML views, PDF and ePub downloads, according to the available data) and Abstracts Views on Vision4Press platform.
Data correspond to usage on the plateform after 2015. The current usage metrics is available 48-96 hours after online publication and is updated daily on week days.
Initial download of the metrics may take a while.