Fig. 6
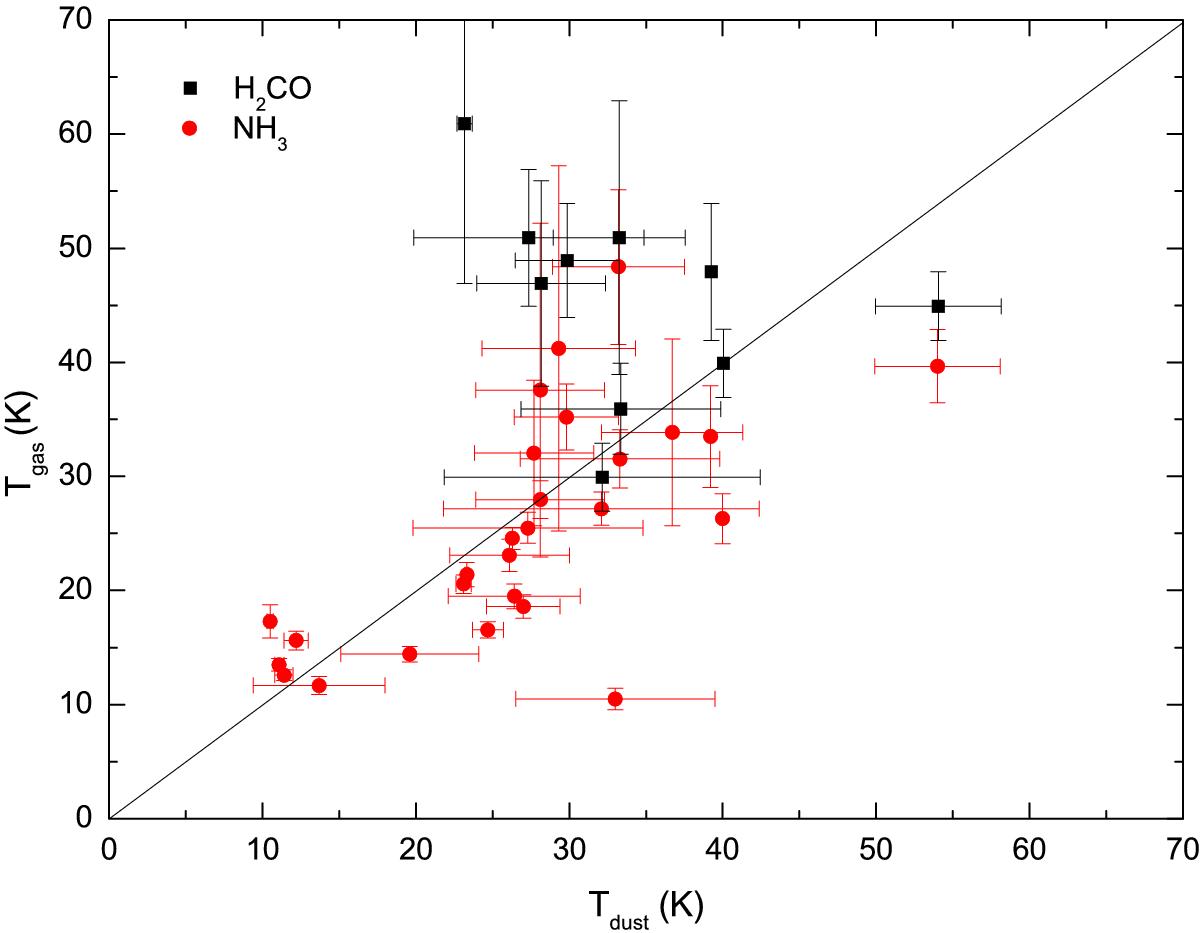
Comparison of gas kinetic temperatures derived from para-H2CO 321–220/303–202 (black squares) and NH3 (2, 2)/(1, 1) (red points) ratios against the HiGal dust temperatures. The straight line indicates locations of equal temperatures. Two sources (G5.97-1.36 and G17.10+1.02) with particularly large Tkin(NH3) errors are not shown here.
Current usage metrics show cumulative count of Article Views (full-text article views including HTML views, PDF and ePub downloads, according to the available data) and Abstracts Views on Vision4Press platform.
Data correspond to usage on the plateform after 2015. The current usage metrics is available 48-96 hours after online publication and is updated daily on week days.
Initial download of the metrics may take a while.