Fig. 4
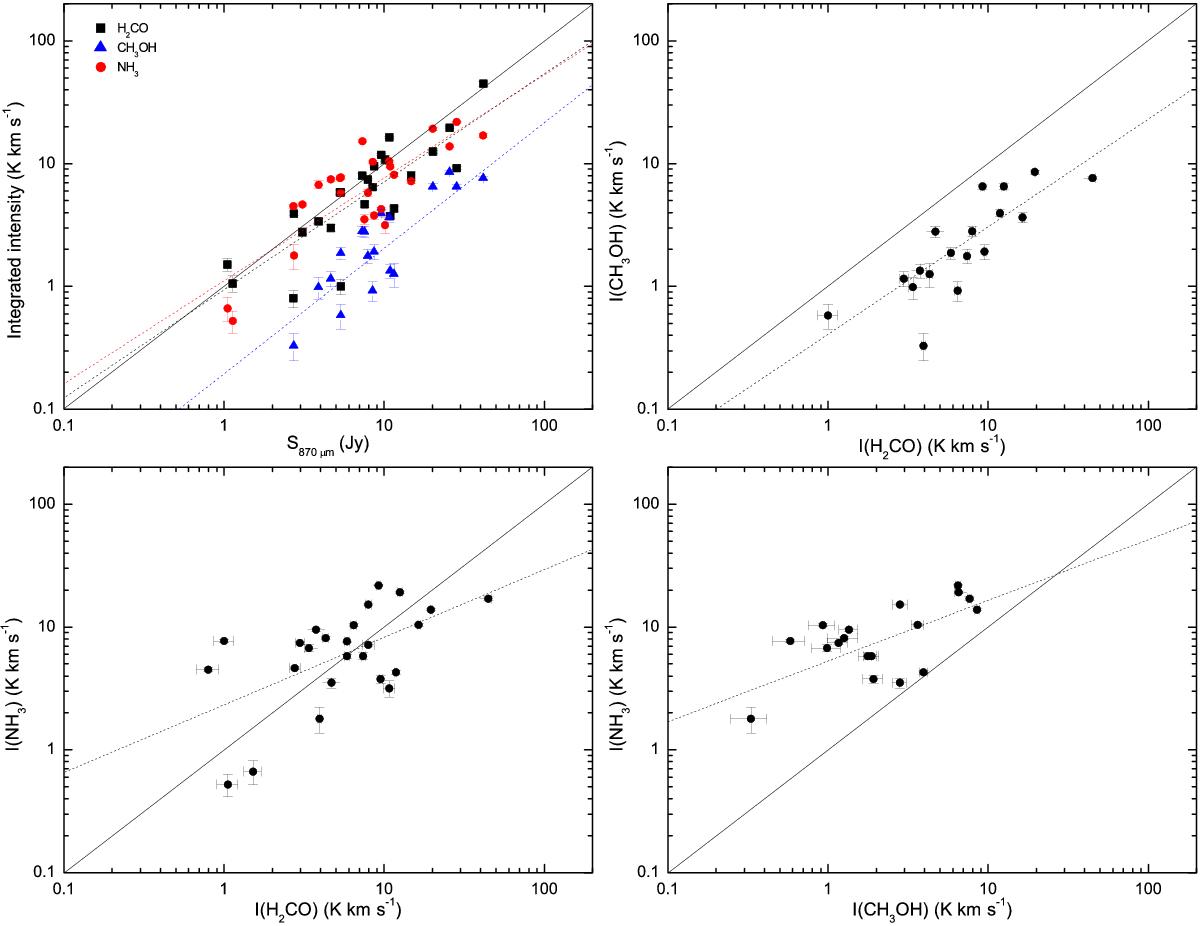
Comparison of integrated intensities of para-H2CO (303–202), CH3OH (422–312), NH3 (1, 1), and 870 μm continuum flux densities. Dashed lines are the results from linear fits. Solid lines correspond to Y = X. Gauss fitted peak temperatures and line widths of NH3 (1, 1) are from Wienen et al. (2012). Assuming Gaussian profiles, we plot integrated intensities calculated with ∫![]() ·Tpk·ΔVFWHM.
·Tpk·ΔVFWHM.
Current usage metrics show cumulative count of Article Views (full-text article views including HTML views, PDF and ePub downloads, according to the available data) and Abstracts Views on Vision4Press platform.
Data correspond to usage on the plateform after 2015. The current usage metrics is available 48-96 hours after online publication and is updated daily on week days.
Initial download of the metrics may take a while.