Fig. 3
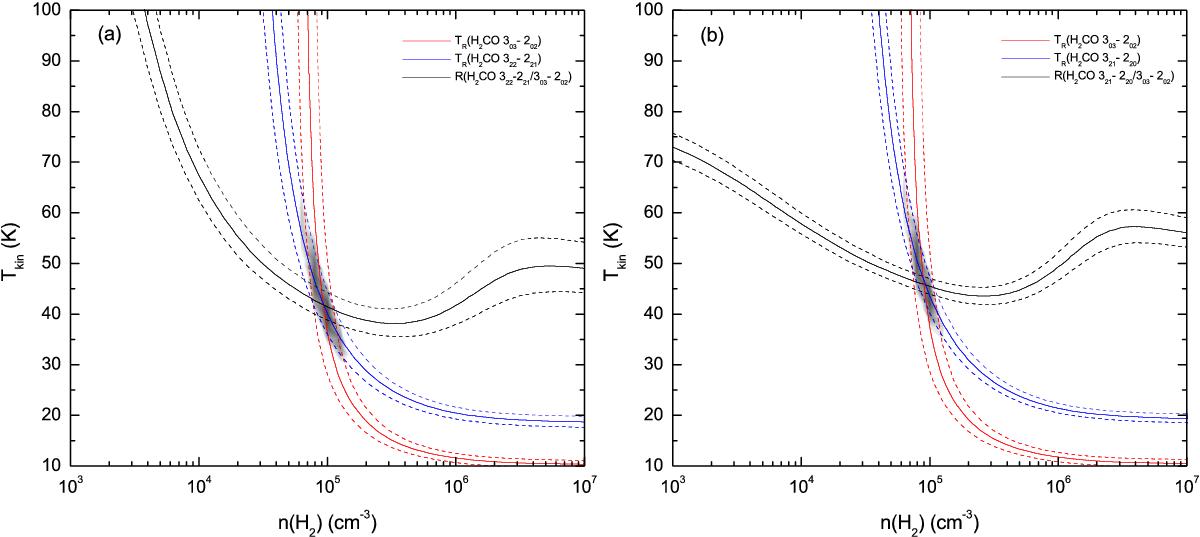
Example of RADEX non-LTE modeling of the para-H2CO kinetic temperature for G5.89-0.39. Para-H2CO 303–202 (red solid and dotted lines represent observed values and uncertainties), 322–221 and 321–220 (a) and b), blue solid and dotted lines) line brightness temperatures and para-H2CO 322–221/303–202 and 321–220/303–202 ratios (black solid and dotted lines). The gray region is characterized by χ![]() (<1.5) with density n(H2) and kinetic temperature Tkin for a para-H2CO column density 4.7 × 1014 cm-2.
(<1.5) with density n(H2) and kinetic temperature Tkin for a para-H2CO column density 4.7 × 1014 cm-2.
Current usage metrics show cumulative count of Article Views (full-text article views including HTML views, PDF and ePub downloads, according to the available data) and Abstracts Views on Vision4Press platform.
Data correspond to usage on the plateform after 2015. The current usage metrics is available 48-96 hours after online publication and is updated daily on week days.
Initial download of the metrics may take a while.