| Issue |
A&A
Volume 598, February 2017
|
|
|---|---|---|
| Article Number | L5 | |
| Number of page(s) | 4 | |
| Section | Letters | |
| DOI | https://doi.org/10.1051/0004-6361/201629671 | |
| Published online | 26 January 2017 | |
Formation and composition of planets around very low mass stars
Physikalisches Institut & Center for Space and Habitability, Universitaet Bern, 3012 Bern, Switzerland
e-mail: This email address is being protected from spambots. You need JavaScript enabled to view it.
; This email address is being protected from spambots. You need JavaScript enabled to view it.
Received: 8 September 2016
Accepted: 13 October 2016
Abstract
Context. The recent detection of planets around very low mass stars raises the question of the formation, composition, and potential habitability of these objects.
Aims. We use planetary system formation models to infer the properties, in particular their radius distribution and water content, of planets that may form around stars ten times less massive than the Sun.
Methods. Our planetary system formation and composition models take into account the structure and evolution of the protoplanetary disk, the planetary mass growth by accretion of solids and gas, as well as planet-planet, planet-star, and planet-disk interactions.
Results. We show that planets can form at small orbital period in orbit about low-mass stars. We show that the radius of the planets is peaked at about 1 R⊕ and that they are, in general, volatile rich especially if proto-planetary disks orbiting this type of stars are long lived.
Conclusions. Close-in planets orbiting low-mass stars similar in terms of mass and radius to those recently detected can be formed within the framework of the core-accretion paradigm as modeled here. The properties of protoplanetary disks, and their correlation with the stellar type, are key to understand their composition.
Key words: planets and satellites: composition / planets and satellites: formation / stars: low-mass
© ESO, 2017
1. Introduction
The recent discovery of planets orbiting low-mass stars, such as TRAPPIST-1 (Gillon et al. 2016) and Proxima Centauri b (Anglada-Escude et al. 2016), as well as the non-detection of similar planets by K2 (Demory et al. 2016) raises the question of the properties of planets forming around very low mass stars. Planets forming in such environments are especially interesting for a number of reasons, as has been recognized a few years ago (e.g., Berta et al. 2012 for M stars; Belu et al. 2013 and He et al. 2017 for brown dwarf). First, the detection and characterization of planets orbiting low-mass stars is easier in general, as the Doppler effect and the transit depth (for transiting planets) are larger for planets of similar mass. Second, as the equilibrium temperature scales with the stellar luminosity, planets in the so-called habitable zone are located closer to the star and at a shorter period. Finally, as we show here and in a companion paper (Alibert et al., in prep., hereafter Paper II), the planet formation process depends on the mass of the central star, either directly, or through the correlation between stellar type and protoplanetary disk properties. The composition of formed planets could therefore be substantially different around low-mass stars than around solar-type stars.
In this paper, we use our population synthesis models (Alibert et al. 2005, 2013; Fortier et al. 2013; Benz et al. 2014, hereafter A13) adapted to the case of very low mass stars to study the formation and the characteristics of planets in this environment. We focus on planets at short periods that are orbiting within 0.1 au, which typically includes the habitable zone for these stars, and we concentrate on the bulk properties of planets (mass, radius, period, and water content). A more detailed analysis on the formation process of these planets as well as a prediction of their potential detection by present and future surveys is the subject of Paper II. We recall in Sect. 2 the physics included in our models, and present results of computations for planets that end their formation inside 0.1 au of the central star (corresponding to a period of roughly 30 days) in Sect. 3.1. The water fraction, radius distribution, and their consequences for habitability are presented in Sect. 3.2, and conclusions are made in Sect. 4.
2. Models
2.1. Formation
Our planet formation models are based on the work of A13, adapted to the case of low-mass stars. The models are described in detail in A13 and Fortier et al. (2013), and take into account different processes. The disk structure and evolution is computed in the framework of the α model by solving the diffusion equation. The thermodynamical conditions in the disk midplane result from the computation of the disk vertical structure. The nominal value of α is taken to be 2 × 10⁻³ in this Letter. The effect of other values, in the range from 10-3 to 10-2, is presented in Paper II. We consider different assumptions regarding the effect of irradiation by the central star: some models are computed ignoring this effect, some are computed taking it into account. For irradiated models, we assume that the flaring angle takes its equilibrium value (9/7, see Hueso & Guillot 2005). The migration of the planet is computed using the formula presented in Dittkrist et al. (2014), which is similar to that of the approach presented by Paardekooper et al. (2011) and allows outward migration in some circumstances. We do not take tidal interactions with the star into account, as they are only important for very close-in planets (see Bolmont et al. 2012). As a consequence, the starting time of our simulations has little effect (it would only modify the irradiation from the star in irradiated models, see below). The planetary embryos grow as a result of planetesimal accretion. The planetesimal accretion rate depends on the planet properties (for example, more massive planets excite planetesimals, lowering the gravitational focussing and therefore the accretion rate, see Fortier et al. 2013). We note that at the beginning of the simulation, the majority of the mass is in the planetesimals and not in the planetary embryos. The initial amount of the planetesimals depends on the local gas surface density and on the disk metallicity. Finally, we do not take shepherding of planetesimals (Tanaka & Ida 1999) or planetesimal radial drift into account in this calculation (Thiabaud & Alibert, in prep.). Planetary embryos can also accrete gas; the accretion rate depends on the internal structure of the gas envelope. This internal structure is computed by solving the standard planetary structure equations. This computation provides the evolution of the planetary mass and composition as a function of time. Finally, the planetary radius is computed using the method presented in Alibert (2014, 2016), and depends on the planetary core composition (in particular its fraction of volatiles) and on the planetary equilibrium temperature.
The models are computed assuming that the mass of the central star is equal to 0.1 M⊙. The mass of the central star affects different important processes. First, the structure of the protoplanetary disk is modified for lower mass stars because the viscous heating (which depends on the Keplerian frequency) and the irradiation depend on the mass, radius, and effective temperature of the central object. Second, the radius of the planetary envelope during the formation phase is equal (for not too small planets) to a fraction of the Hill radius, which depends on the mass of the central body (as a consequence, gas accretion is a function of the mass of the central star). Finally, the distribution of the disk mass is modified compared to the case of solar-type stars (see below).
2.2. Initial conditions
We considered a series of a few hundred to thousands of identical stars, with masses equal to 0.1 M⊙, radii equal to 1.004 R⊙ and an effective temperature of 2935 K. These latter parameters are important for models including irradiation from the central star, and were taken from the evolution tracks of Baraffe et al. (2015) at an age of 1 Myr. Around each of these stars, a protoplanetary disk was assumed to exist (we did not model the formation of this disk, nor the formation of initial planetary embryos). The disk profiles follow the profile previously used in A13, where the disk parameters were derived from the observations of Andrews et al. (2010).
The distribution of disk masses around low-mass stars is poorly known, but can be somewhat constrained from observations, which show that the accretion rate onto the star scales with the square of the stellar mass (e.g., Natta et al. 2004). Assuming that the viscosity parameter does not depend on the mass of the star, Alibert et al. (2011) showed that this latter correlation is well reproduced for a distribution of the disk masses Mdisc following  . We note that this correlation is consistent with the one derived by Andrews et al. (2013), who quoted a linear relation between stellar and disk masses, and with the recent results by Pascucci et al. (2016), who quoted an exponent from 1.3 to 1.9. The distribution of disk masses we use in this Letter is therefore similar to the one used in A13, Thiabaud et al. (2014), but scaled down by a factor 0.11.2. Practically, the disk profile is the same, the normalization of the surface density at 5 au being reduced by this numerical factor. To test the effect of this scaling, we also computed a population assuming that the mass of the disk is twice higher, decreasing the viscosity by a factor 2, to keep the accretion rate unchanged. The other parameters are unchanged.
The disk lifetime was assumed to be independent of mass of the central star, and its distribution is therefore similar to the one by A13: the cumulative distribution of disk lifetimes decays exponentially with a characteristic time of 2.5 Myr. However, some recent observations point toward a dependance of the disk lifetime on stellar mass. For example, Ribas et al. (2015) compared the disk lifetime around stars larger than 2 M⊙ versus stars smaller than 2 M⊙ and found that the former have a significantly shorter lifetime. It is not clear whether this trend can be extrapolated to the low-mass stars we consider here, but to test this possibility, we also computed a model with a disk lifetime ten times longer (a value that would follow from a disk lifetime inversely proportional to stellar mass). For this model, we considered only one planet per disk.
We considered that 10 planets grow in the same protoplanetary disk. The initial masses of the planetary embryos are equal to the mass of the Moon, and the initial location of the planetary embryo is drawn at random, the probability distribution of this initial location being uniform in log, between an inner radius of 0.01 au and an outer radius of 5 au. Tests have shown that planets initially located outside 5 au do not reach the innermost 0.1 au of the protoplanetary disk and that they do not influence for growth and migration of innermost planets (in the case of 10 planets forming in the same disk). The choice of 10 planetary embryos (and not more) is dictated essentially by computer-time constraints, as the time needed to run a model (on the order of a few days per planetary system) scales as the square of the number of planetary embryos. We ran some tests considering 20 planetary embryos, however, and we did not find significant differences compared to the case of only 10 planetary embryos. This result is consistent with A13, who demonstrated that the properties of planets larger than 5 M⊕ (for a 1.0 M⊙ star) do not depend on the number of embryos, provided this number is larger enough (10). In the case of formation around 0.1 M⊙ stars, the properties of planets larger than 0.5 M⊕ should not depend on the number of embryos when the number is larger than 10. A more in-depth discussion of the effect of the number of embryos will be presented in Paper II.
3. Results
3.1. Orbital and bulk properties of formed planets
Figure 1 shows the distribution of mass to semi-major axis of planets located inside 0.1 au in the case of our nominal model. The color code shows the fraction of water accreted in solid form by the planets (see next section). The distribution of masses and semi-major axis is globally similar when only one planet forms in a protoplanery disk.
A detailed analysis of the populations and some prediction of their observability will be presented in Paper II. When we compare the simulations presented in this Letter, the population of planets is not strongly affected by the irradiation by the central star. This is expected because the planets we considered form in the inner parts of the disk, which is dominated by viscous heating. On the other hand, more important differences come from the massive disk population, where more massive planets are produced, and from the long-lived disk population, where planets that end up inside 0.1 au and do not collide with the star originate from larger distances. The first effect is simply due to the higher available mass, whereas the second effect is a result of the longer time available for migration: since the migration rate is similar in the nominal population and the one with longer disk lifetimes, planets that migrate within a given region of the disk (inside 0.1 au) must come from farther out. As we show below, this has important consequences on the water content of the planets.
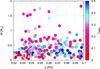 |
Fig. 1 Mass versus semi-major axis in our nominal model (disk mass |

We also checked the rate of planetary systems forming in our simulations. For this, we considered all the systems that end with at least one planet more massive than 0.5 at a location M⊕ closer than 0.1 au. In these systems, ~ 76% are single-planet systems, 16% are two-planet systems, 6% are three-planet systems, and 2% are four-planet systems (the statistics is very low for this latter case, however). A more detailed study of the architecture of the systems for the different populations we have considered will be presented in Paper II.
3.2. Water content, radius, and consequence for habitability
The amount of water depends upon the location at which the planet has accreted planetesimals whose composition is determined by the thermal structure of the disk (in particular, the location of the ice line, defined here as the innermost location of icy planetesimals). The location of the ice line depends on the thermal structure of disk, which in turn is a function of the disk mass and ranges from 0.1 to 0.5 au in the majority of the cases. As radial drift and recondensation of water are negligible on large scales (Kornet et al. 2001), the location of the ice line does not evolve with time. The fraction of volatiles accreted by the planets in the different populations is shown in Fig. 2. The distribution of water fraction is broad in all the cases, with a significant fraction of planets harboring more than 10% of water in all the cases. An interesting feature is that planets forming in long-lived disks all have a fraction of water higher than 10%. The reason for this large abundance is that planets have more time to migrate. Those that end inside 0.1 au therefore come from beyond 0.5 au, where the temperature is lower than the condensation temperature of water, and at the beginning of their formation they accrete substantial amounts of icy planetesimals. In the case of massive disks (disk masses being twice as high), the fraction of dry planets is much higher, and no planet has a water fraction higher than ~ 35%. This results from the fact that viscous heating scales with the mass of the disk. Massive disks are therefore much hotter, the ice line is located at a larger distance, and planets completing their formation within 0.1 au are poorer in water.
In the models we considered, the water fraction and the planetary mass are correlated: planets that do not contain much water are generally of lower mass (below ~ 1 M⊕, although some can be as massive as ~ 1.5 M⊕), and planets totally devoid of water are all less massive than 1 M⊕, and even lower than 0.4 M⊕ when the massive disks are not considered. This can be easily understood as an effect of migration: more massive planets migrate from farther out, collect some material from outside the ice line (located between 0.1 and 1 au for the different models we considered), and are enriched in water.
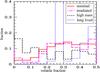 |
Fig. 2 Distribution of volatile content for the population indicated in the legend. |
We used the method developed by Alibert (2014, 2016) to compute the planetary radius. Interestingly enough, the majority of planets within 0.1 au have very small gaseous envelopes (of about 1% at most). We find this mass to be correlated with the total mass and the semi-major axis of the planet (see Paper II for a more detailed discussion). As this fraction is very small, the planetary luminosity (or age) has a very small influence on the planetary radius. To save computer time, we therefore did not compute the long-term thermodynamical evolution of the planets, but we assumed that the specific luminosity of these planets follows the relation reported by Rogers et al. (2011). We checked that increasing or decreasing the planetary luminosity by one order of magnitude compared to the relation given by Rogers et al. (2011) does not change the resulting radius. The radius of the planetary core, on the other hand, does depend on the composition of the planet, in particular the fraction of volatiles and the Mg/Si and Mg/Fe ratios in the planet. In our computations we therefore took the volatile content of each planet (shown in the previous section) into account and assumed the Mg/Si and Mg/Fe ratios to be solar. The volatile content in the planets results from the formation model as shown in the previous section.
A clear feature of our models is a peak at ~ 1 R⊕ and a rapid cutoff at larger radii. This peak is caused by a lower and upper limit in the possible planetary mass. First, at short distance to the star, the solid mass in the protoplanetary disk is low (in particular when the disk mass scales with the stellar mass). Planets of at least a fraction of an Earth mass must therefore have migrated from farther out in the disk. As type I migration (which is important in this mass range) increases with planetary mass, only planets more massive than a fraction of an Earth mass can migrate from these larger distances to within 0.1 au of the star. Second, even with migration, the total mass available to form planet is limited by the low mass of the disks. It is therefore difficult to assemble a total mass higher than several Earth masses, with a corresponding radius in the 1−1.5 R⊕ range. This explains the rapid decrease in the radius distribution at radii larger than ~ 1.3 R⊕. We note that this absence of larger planets is compatible with the non-detection by K2 of planets orbiting low-mass M stars (see Demory et al. 2016). In the case of massive disks, a population of planets at larger radii appears (hints of this population are visible in Fig. 3), and this population should have been detected by K2 (see Demory et al. 2016). The non-detection of this population therefore tends to favor disk masses that follow the quasi-linear scaling between the disk and stellar mass.
The amount of water is important for habitability, as it is required for life as we know it, but at the same time, too large amounts of water may be detrimental for habitability, at least for habitability as we know it on Earth, for at least two reasons. First, a water layer that is too deep causes a high-pressure ice layer at the bottom of the global ocean. This in turn prevents a carbonate-silicate cycle (Walker et al. 1981) that could regulate the surface temperature over long timescales (Alibert 2014). In the case of low-mass stars, which evolve on much longer timescales, this may not be a great problem because the stellar flux varies on timescales much longer than in the case of the Sun. In this situation, a process that stabilizes the surface temperature may not be necessary. The second reason is connected to the fact that for planets with too much water an unstable CO2 cycle destabilizes the climate, making habitability more challenging (Kitzmann et al. 2015). Again, this was demonstrated for solar-type stars, and a similar process might exist for low-mass stars.
If, as it is the case for solar-type stars, a large fraction of water does prevent habitability, the majority of planets formed in our models would not be habitable. The water mass fraction is in general larger than ~ 10%, and water evaporation has been claimed to be inefficient for planets in the habitable zone of low-mass stars (Ribas et al. 2016).
4. Conclusion
Our models show that planets quite similar in terms of mass and radius to those recently detected by Gillon et al. (2016) and Anglada-Escude et al. (2016) can be formed within the framework of the core-accretion paradigm as modeled here. Moreover, the models predict a radius distribution for these close-in planets that is relatively sharply peaked at about 1.
Our results are consistent with those of Coleman et al. (2016), in particular their scenario (ii), which is similar to theone we model here. On the other hand, other simulations concluded that planets forming around low-mass stars should be less massive and very dry (e.g., Lissauer 2007; Raymond et al. 2007; Ciesla et al. 2015). The main reason for this difference is that these later simulations consider the long-term evolution of a swarm of massive planetesimals after the gas disk has disappeared. In this case, no migration of planets can occur, and planets currently located in the habitable zone accrete their mass inside the ice line, resulting in a much lower water content. The key role of migration on the water content of planets around low-mass stars that is demonstrated here is consistent with the results of Ogihara & Ida (2009).
Finally, our models show that the properties of the disk and their potential correlation with the mass of the star are the most important parameters determining the characteristics, in particular the water content, of the emerging planet population. In this context, observational constraints on mass and lifetime of disks in orbit of low-mass stars become of paramount importance.
Acknowledgments
We thank M. Meyer and A. Dutrey for useful discussions. This work was supported in part by the European Research Council under grant 239605. This work has been carried out within the frame of the National Centre for Competence in Research PlanetS supported by the Swiss National Science Foundation. The authors acknowledge the financial support of the SNSF.
References
- Alibert, Y. 2014, A&A, 561, A41 [NASA ADS] [CrossRef] [EDP Sciences] [Google Scholar]
- Alibert, Y. 2016, A&A, 591, A79 [NASA ADS] [CrossRef] [EDP Sciences] [Google Scholar]
- Alibert, Y., Mordasini, C., Benz, W., & Winisdoerfer, C. 2005, A&A, 434, 343 [NASA ADS] [CrossRef] [EDP Sciences] [Google Scholar]
- Alibert, Y., Mordasini, C., & Benz, W., 2011, A&A, 526, A63 [NASA ADS] [CrossRef] [EDP Sciences] [Google Scholar]
- Alibert, Y., Carron, F., Fortier, A., et al. 2013, A&A, 558, A109 [NASA ADS] [CrossRef] [EDP Sciences] [Google Scholar]
- Andrews, S. M., Wilner, D. J., Huges, A. M., Qi, C., & Dullemon, C. P. 2010, ApJ, 723, 1241 [NASA ADS] [CrossRef] [Google Scholar]
- Andrews, S. M., Rosenfeld, K. A., Kraus, A. L., & Wilner, D. J. 2013, ApJ, 771, 129 [NASA ADS] [CrossRef] [Google Scholar]
- Anglada-Escude, G., Amado, P. J., Barnes, J., et al. 2016, Nature, 536, 437 [NASA ADS] [CrossRef] [PubMed] [Google Scholar]
- Baraffe, I., Homeier, D., Allard, F., & Chabrier, G. 2015, A&A, 577, A42 [NASA ADS] [CrossRef] [EDP Sciences] [Google Scholar]
- Belu, A. R., Selsis, F., Raymond, S. N., et al. 2013, ApJ, 768, 125 [NASA ADS] [CrossRef] [Google Scholar]
- Benz, W., Ida, Z., Alibert, Y., Lin, D., & Mordasini, C., Protostars and Planets VI (Tucson: University of Arizona Press), 691 [Google Scholar]
- Berta, Z. K., Irwin, J., Charbonneau, D., Burke, C. J., & Falco, E. E. 2012, ApJ, 144, 145 [Google Scholar]
- Bolmont, E., Raymond, S., Lecont, J., & Matt, S. 2012, A&A, 544, A124 [NASA ADS] [CrossRef] [EDP Sciences] [Google Scholar]
- Ciesla, F. J., Mulders, G. D., Pascucci, I., & Apai, D. 2015, ApJ, 804, 9 [NASA ADS] [CrossRef] [Google Scholar]
- Demory, B.-O., Queloz, D., Alibert, Y., Gillen, E., & Gillon, M. 2016, ApJ, 825, L25 [NASA ADS] [CrossRef] [Google Scholar]
- Dittkrist, K. M., Mordasini, C., Klahr, H., Alibert, Y., & Henning, T. 2014, A&A, 567, A121 [NASA ADS] [CrossRef] [EDP Sciences] [Google Scholar]
- Fortier, A., Alibert, Y., Carron, F., Benz, W., & Dittkrist, K. M. 2013, A&A, 549, A44 [NASA ADS] [CrossRef] [EDP Sciences] [Google Scholar]
- Gillon, M., Jehin, E., Lederer, S. M., et al. 2016, Nature, 533, 221 [NASA ADS] [CrossRef] [PubMed] [Google Scholar]
- He, A., Triaud, A., & Gillon, M. 2017, MNRAS, 464, 2687 [NASA ADS] [CrossRef] [Google Scholar]
- Hueso, R., & Guillot, T. 2005, A&A, 442, 703 [NASA ADS] [CrossRef] [EDP Sciences] [Google Scholar]
- Kornet, K., Stepinski, T. F., & Różyczka, M. 2001, A&A, 378, 180 [NASA ADS] [CrossRef] [EDP Sciences] [Google Scholar]
- Kitzmann, D., Alibert, Y., Godolt, M., et al. 2015, MNRAS, 452, 3752 [NASA ADS] [CrossRef] [Google Scholar]
- Lissauer, J. 2007, ApJ, 660, 149 [Google Scholar]
- Natta, A., Testi, L., Muzerolle, J., et al. 2004, A&A, 424, 603 [NASA ADS] [CrossRef] [EDP Sciences] [Google Scholar]
- Ogihara, M., & Ida, S. 2009, ApJ, 699, 824 [NASA ADS] [CrossRef] [Google Scholar]
- Paardekooper, S. J., Baruteau, C., & Kley, W. 2011, MNRAS, 410, 293 [NASA ADS] [CrossRef] [Google Scholar]
- Pascucci, I., Testi, L., Herczeg, G. J., et al. 2016, ApJ, 831, 125 [NASA ADS] [CrossRef] [Google Scholar]
- Raymond, S., Scalo, J., & Meadows, V. 2007, ApJ, 669, 606 [Google Scholar]
- Ribas, A., Bouy, H., & Merin, B. 2015, A&A, 576, A52 [NASA ADS] [CrossRef] [EDP Sciences] [Google Scholar]
- Ribas, I., Bolmont, E., Selsis, F., et al. 2016, A&A, 596, A111 [NASA ADS] [CrossRef] [EDP Sciences] [Google Scholar]
- Rogers, L., Bodenheimer, P., Lissauer, J., & Seager, S. 2011, ApJ, 738, 59 [NASA ADS] [CrossRef] [Google Scholar]
- Tanaka, H., & Ida, S. 1999, Icarus, 139, 350 [NASA ADS] [CrossRef] [Google Scholar]
- Thiabaud, A., Marboeuf, U., Alibert, Y., et al. 2014, A&A, 562, A27 [NASA ADS] [CrossRef] [EDP Sciences] [Google Scholar]
- Walker, J., Hays, P., & Kasting, J. 1981, J. Geophys. Res., 86, 9776 [Google Scholar]
All Figures
|
Fig. 1 Mass versus semi-major axis in our nominal model (disk mass |
| In the text | |
|
Fig. 2 Distribution of volatile content for the population indicated in the legend. |
| In the text | |
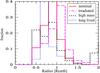 |
Fig. 3 Histogram of radii for the same cases as in Fig. 2. |
| In the text | |
Current usage metrics show cumulative count of Article Views (full-text article views including HTML views, PDF and ePub downloads, according to the available data) and Abstracts Views on Vision4Press platform.
Data correspond to usage on the plateform after 2015. The current usage metrics is available 48-96 hours after online publication and is updated daily on week days.
Initial download of the metrics may take a while.