Fig. 5
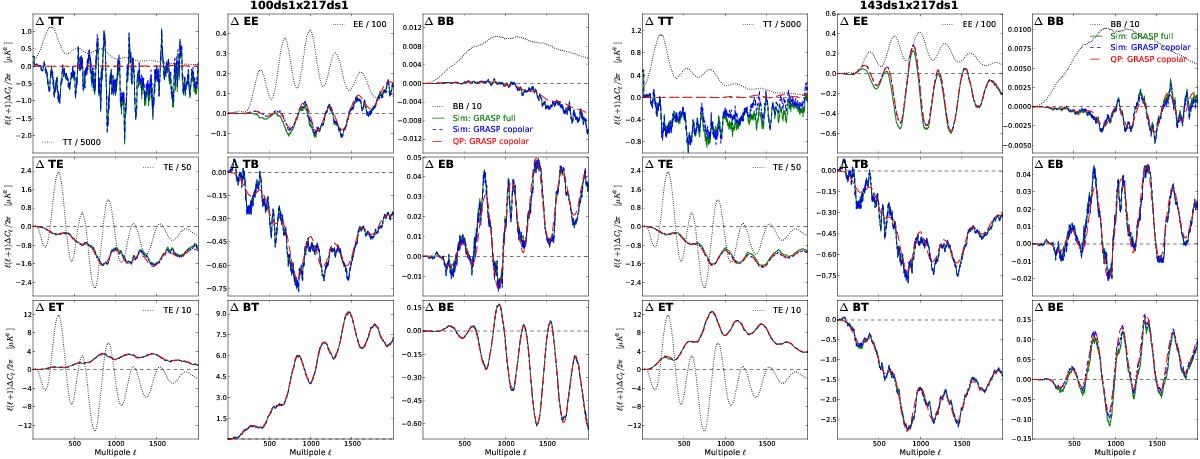
Comparison to simulations for 100ds1x217ds1 (lhs panels) and 143ds1x217ds1 (rhs panels) cross power spectra, for computer simulated beams. In each panel is shown the discrepancy between the actual ℓ(ℓ + 1)Cℓ/ 2π and the one in input, smoothed on Δℓ = 31. Results obtained on simulations with either the full beam model (green curves) or the co-polarized beam model (blue dashes) are to be compared to QuickPol analytical results (red long dashes). In panels where it does not vanish, a small fraction of the input power spectrum is also shown as black dots for comparison.
Current usage metrics show cumulative count of Article Views (full-text article views including HTML views, PDF and ePub downloads, according to the available data) and Abstracts Views on Vision4Press platform.
Data correspond to usage on the plateform after 2015. The current usage metrics is available 48-96 hours after online publication and is updated daily on week days.
Initial download of the metrics may take a while.